DEE Development Engineers Ltd – Attempting Reversal with Volume Backing & RSI Confirmation
DEEDEV
Technical Chart Overview (Daily Timeframe)
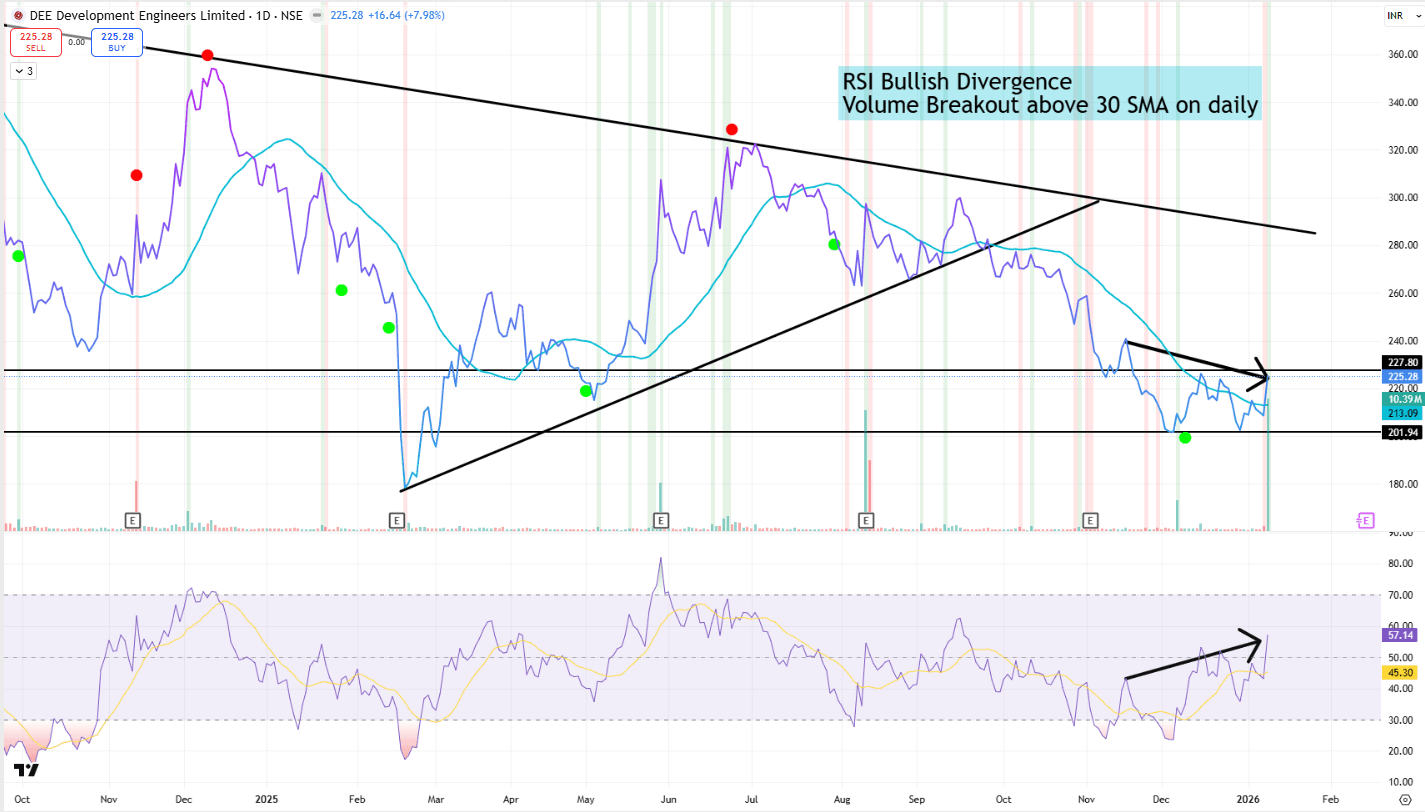
The stock has been moving within a contracting triangle pattern, marked by lower highs and higher lows, suggesting a potential symmetrical triangle breakout scenario.
Recent price action has shown a strong bounce from the ₹201–₹213 support zone, with a solid move of +7.98% on the breakout day.
Importantly, price has managed to close above the 30-day SMA, accompanied by a notable increase in volume, giving the breakout short-term credibility.
📈 Momentum Clues (RSI Insight)
A bullish RSI divergence is clearly visible — while price made a lower low recently, RSI printed a higher low, hinting at underlying strength.
RSI has now moved above 57 and is approaching the 60 level. If it sustains above 60, it could trigger positive momentum expansion.
🔄 Trend & Structure Interpretation
Despite the broader downtrend, this breakout backed by divergence and support retest could indicate a possible short- to medium-term reversal setup.
The pattern resembles an accumulation phase following a prolonged decline, with buyers stepping in at consistent demand zones.
📍 Key Levels to Watch
Immediate resistance: ₹228–₹234 (upper trendline of the triangle).
Breakout confirmation: Sustained close above ₹234 on volume.
Support zone: ₹201–₹213 remains crucial — a breakdown below would negate the setup.
🧩 Strategic View
If price sustains above the triangle resistance and RSI confirms momentum, this could be an early-stage reversal after long consolidation. However, it’s still within a neutral pattern structure and needs a follow-through for clarity.
📢 Disclaimer: For educational and technical analysis purposes only; not investment advice.
👤 Rajneesh Sharma – SEBI Registered Research Analyst (INH000020332)