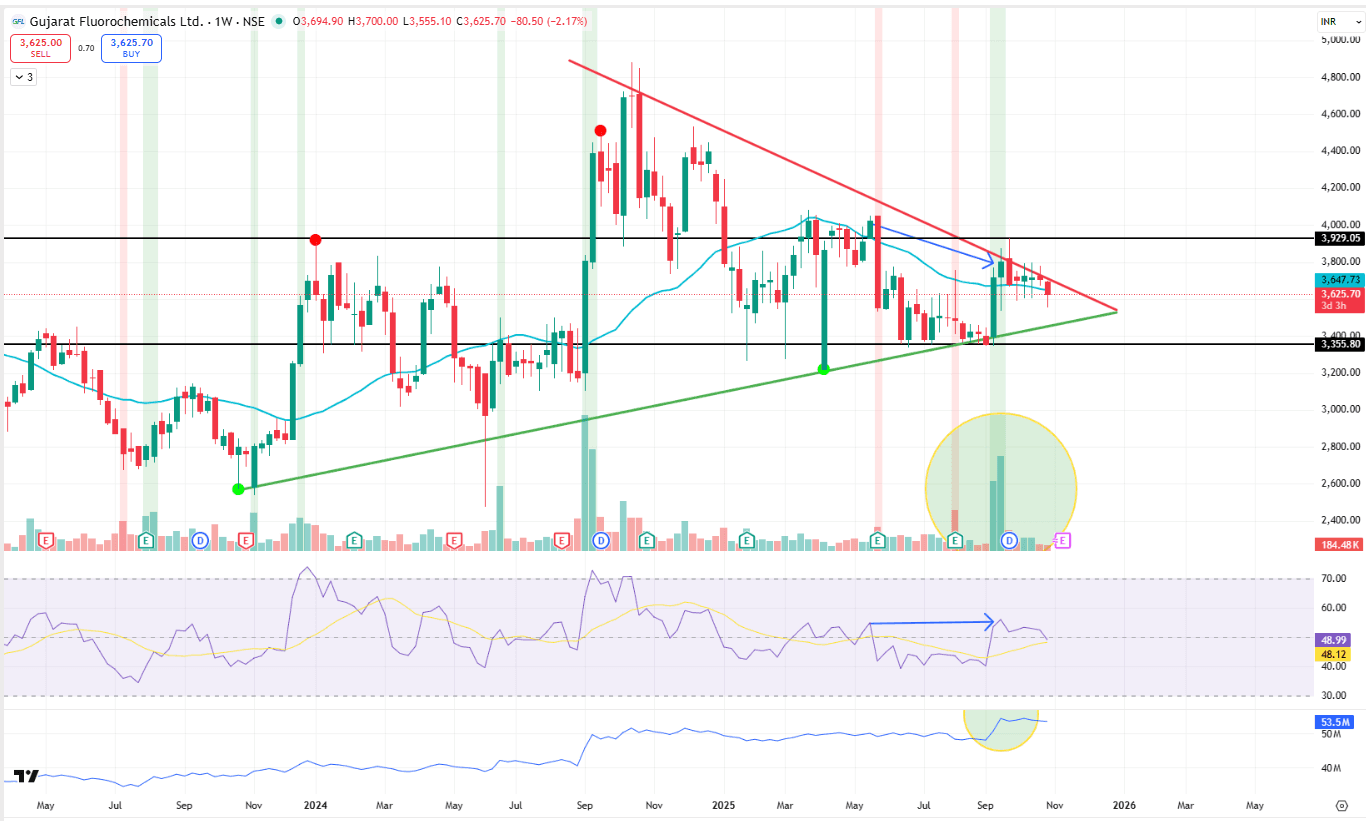
📊 Gujarat Fluorochemicals Ltd. – Symmetrical Triangle Contraction Near Breakout Point
FLUOROCHEM
Gujarat Fluorochemicals is trading inside a well-defined symmetrical triangle pattern, representing a phase of price compression and energy buildup. The stock is now approaching the apex of the triangle, where a decisive breakout or breakdown move is likely imminent.
🔹 Technical Overview
Pattern: Symmetrical Triangle (since mid-2023)
Resistance Line: Descending from ₹4,800 (red trendline)
Support Line: Rising from ₹3,000 (green trendline)
Key Levels:
Resistance: ₹3,930–₹3,950
Support: ₹3,355–₹3,300
RSI: Near neutral zone (~49) after mild bearish divergence but holding above 40 — momentum cooling off but not weak.
OBV: Bounced recently (circled in yellow), showing renewed buying interest post heavy volume weeks.
Volume: Noticeable spike (highlighted) during recent rebounds, suggesting accumulation on dips.
🔹 Interpretation
⚙️ The triangle structure indicates consolidation before a large directional move.
⚙️ The OBV uptick suggests underlying accumulation even as price moves sideways.
⚙️ Breakout Confirmation: Weekly close above ₹3,950 could lead to a strong rally toward ₹4,400–₹4,600.
⚠️ Breakdown Trigger: Sustained close below ₹3,300 would negate the pattern and expose ₹3,000.
🟢 View
Momentum and structure indicate the stock is coiling tightly before a breakout, with the bias slightly tilted bullish due to higher lows and improving OBV. Watching ₹3,950 for a volume-backed breakout would be key for confirmation.
📢 Disclaimer: For educational and technical analysis purposes only; not investment advice.
👤 Rajneesh Sharma – SEBI Registered Research Analyst (INH000020332)