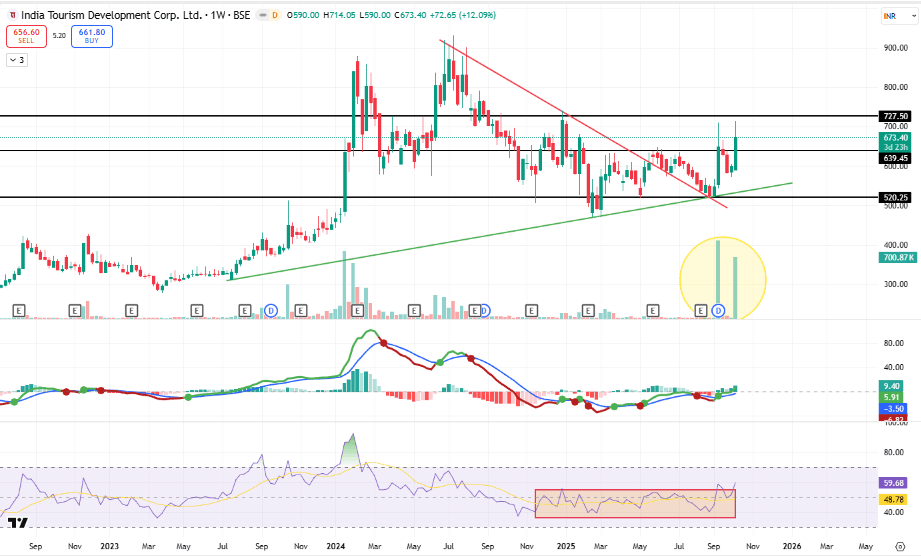
🏨 India Tourism Development Corp. Ltd. (ITDC) – Breakout with Volume Surge
ITDC
🔹 Price Action
CMP: ₹673.40 (+12.09%)
The stock has given a breakout from descending trendline resistance after months of consolidation.
A sharp surge in volume highlights renewed institutional participation.
🔹 Technical Observations
Pattern: Descending triangle breakout supported by strong volume.
Trendline Support: Well-maintained long-term rising trendline since 2022.
Volume: Massive increase (highlighted zone), indicating strong buying interest.
RSI: Broke out from consolidation box; currently around 59.7, showing fresh bullish momentum.
MACD: Positive crossover above the zero line, confirming trend reversal.
Structure: Price making higher lows, suggesting accumulation and strength building.
🔹 Key Levels
Immediate Resistance: ₹705.
Major Resistance: ₹777.
Immediate Support: ₹639.
Major Support: ₹520.
🔹 Strength & Risk
✅ Breakout supported by strong volumes and MACD confirmation.
✅ RSI momentum strengthening with higher lows.
✅ Long-term rising trendline intact since 2022.
❌ Resistance zone near ₹705–₹777 may trigger profit booking.
❌ Sustained close above ₹705 needed for continuation confirmation.
🔹 Outlook
Short Term: Positive; move above ₹705 can extend rally to ₹777–₹820.
Medium Term: Sustained breakout above ₹777 could target ₹950+.
Risk: Breakdown below ₹639 may lead to consolidation toward ₹520.
📌 Strategy
Traders: Watch for sustained close above ₹705 with volume; can ride momentum up to ₹770+.
Investors: Accumulate in ₹640–670 range; maintain SL below ₹620 for medium-term targets ₹820–₹950.
📢 Disclaimer: This is for educational purposes only, not investment advice.
🧑💼 Rajneesh Sharma – SEBI Registered Research Analyst (INH000020332)