KSB Ltd — Channel Breakout With Momentum Expansion Attempt
KSB
🔍 Technical Analysis
1️⃣ Price Structure & Trendlines:
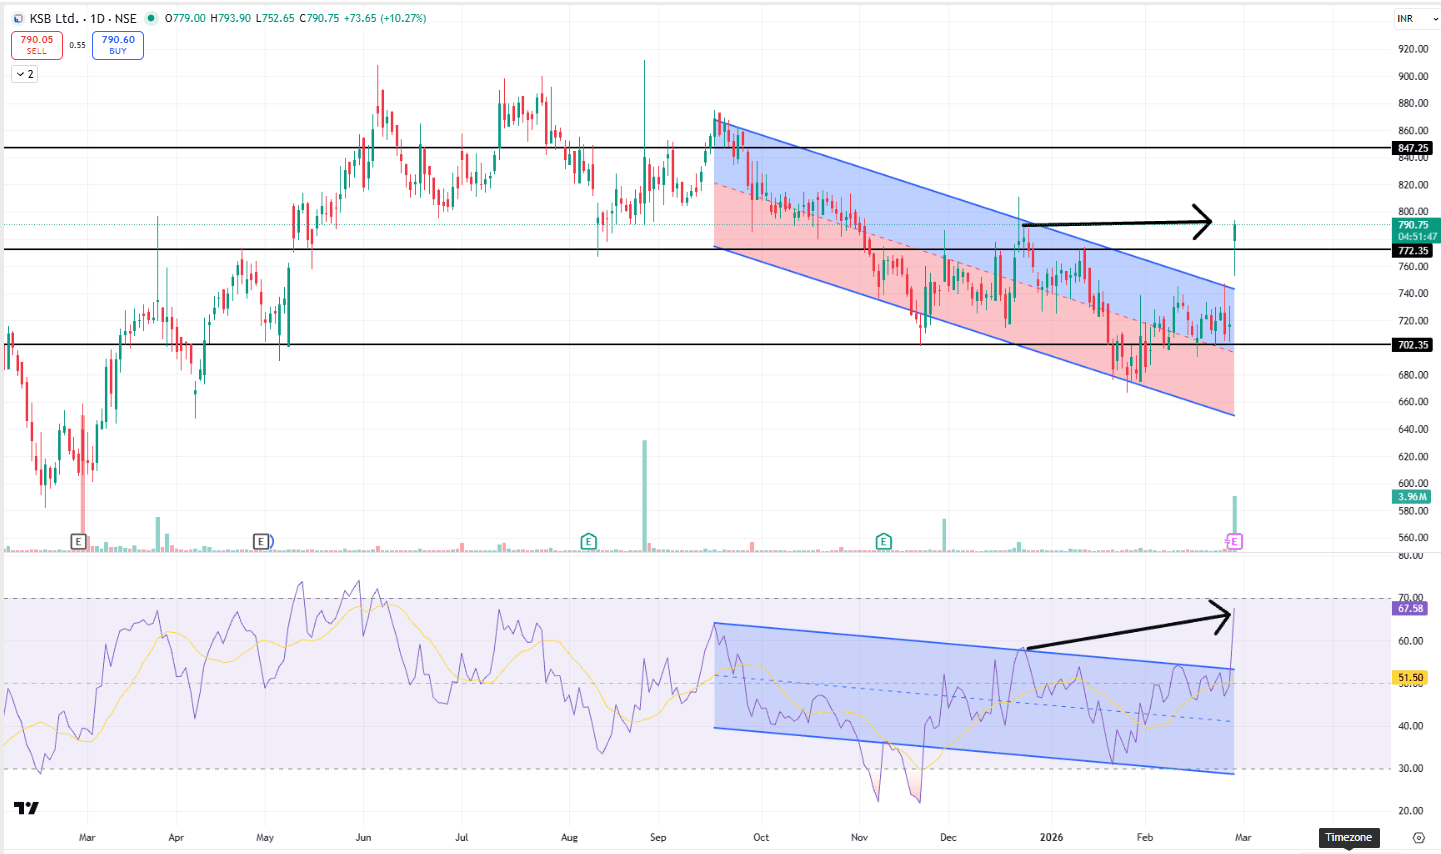
Price has broken above a falling channel that governed the corrective phase since prior highs. The breakout attempt is approaching a key horizontal resistance band, indicating a potential shift from correction toward accumulation if sustained.
2️⃣ Key Levels:
• ₹847: Major overhead resistance from previous supply zone.
• ₹772–780: Immediate breakout zone; now acting as near-term support.
• ₹702: Lower demand area aligned with prior swing base and channel lows.
3️⃣ Breakout Behaviour:
The move above the descending structure suggests selling pressure is weakening. However, the breakout still requires follow-through above ₹800+ to confirm structural reversal rather than a relief rally inside a broader range.
4️⃣ Volume Characteristics:
Volume expansion on the latest candle indicates participation returning after a quieter consolidation phase, supporting the breakout narrative but still needing continuity.
5️⃣ RSI & Momentum:
RSI shows bullish divergence along with a breakout from its consolidation channel, signalling improving internal momentum even before price confirmation — often an early sign of strength.
📢 Disclaimer: For educational and technical analysis purposes only; not investment advice.
👤 Rajneesh Sharma – SEBI Registered Research Analyst (INH000020332)