🔧 KSB Ltd – Recovery in Progress but Facing Key Resistance
KSB
🔹 Price Action
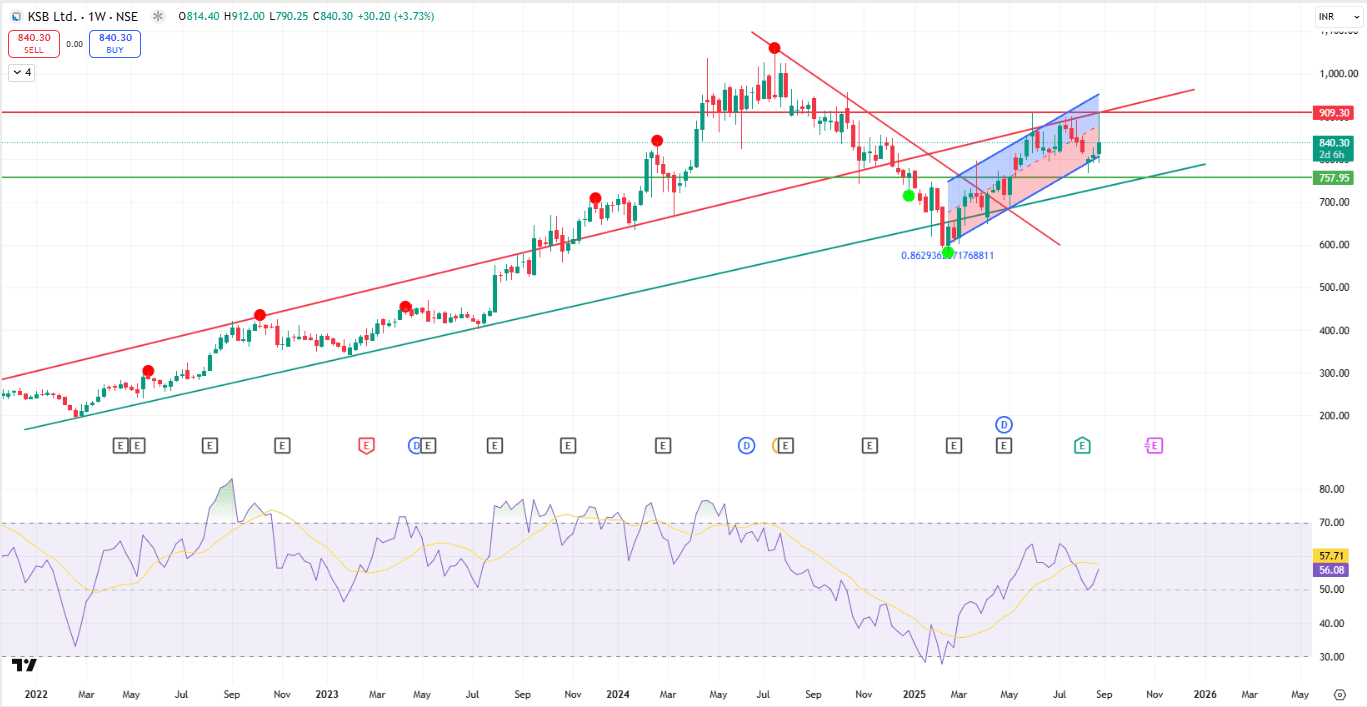
KSB Ltd is currently trading near ₹840, rebounding strongly after a dip towards ₹620 levels earlier this year. The stock has formed a short-term rising channel (blue) within its broader long-term uptrend (red trendline).
🔹 Technical View
Support: ₹758
Resistance: ₹909
Trendlines: Price is attempting to sustain above the rising blue channel, but the overhead ₹900–910 resistance zone has capped upside moves in the past.
RSI: Improving and holding above 50, showing momentum recovery after a deep correction.
🔹 Levels to Watch
Immediate Support: ₹758 (green trendline)
Major Resistance: ₹909
Breakout Watch: A close above ₹910 could re-open the long-term bullish trend, while failure here may lead to a pullback towards supports.
📊 Summary
KSB Ltd is showing encouraging signs of recovery, supported by the rising channel and strengthening RSI. However, the stock faces a make-or-break resistance at ₹909. Sustaining above this level will confirm renewed bullish momentum, while rejection could trigger a retest of lower supports.
📢 Disclaimer: This is for informational purposes only. Nothing herein constitutes a buy or sell recommendation.
🧑💼 Rajneesh Sharma is a SEBI-registered Research Analyst (Reg. No. INH000020332).
📄 Investments are subject to market risks. Read all related documents carefully before investing.