
‹ All Posts
Rajneesh Sharma CFTe

2nd Feb · SEBI-Registered Analyst

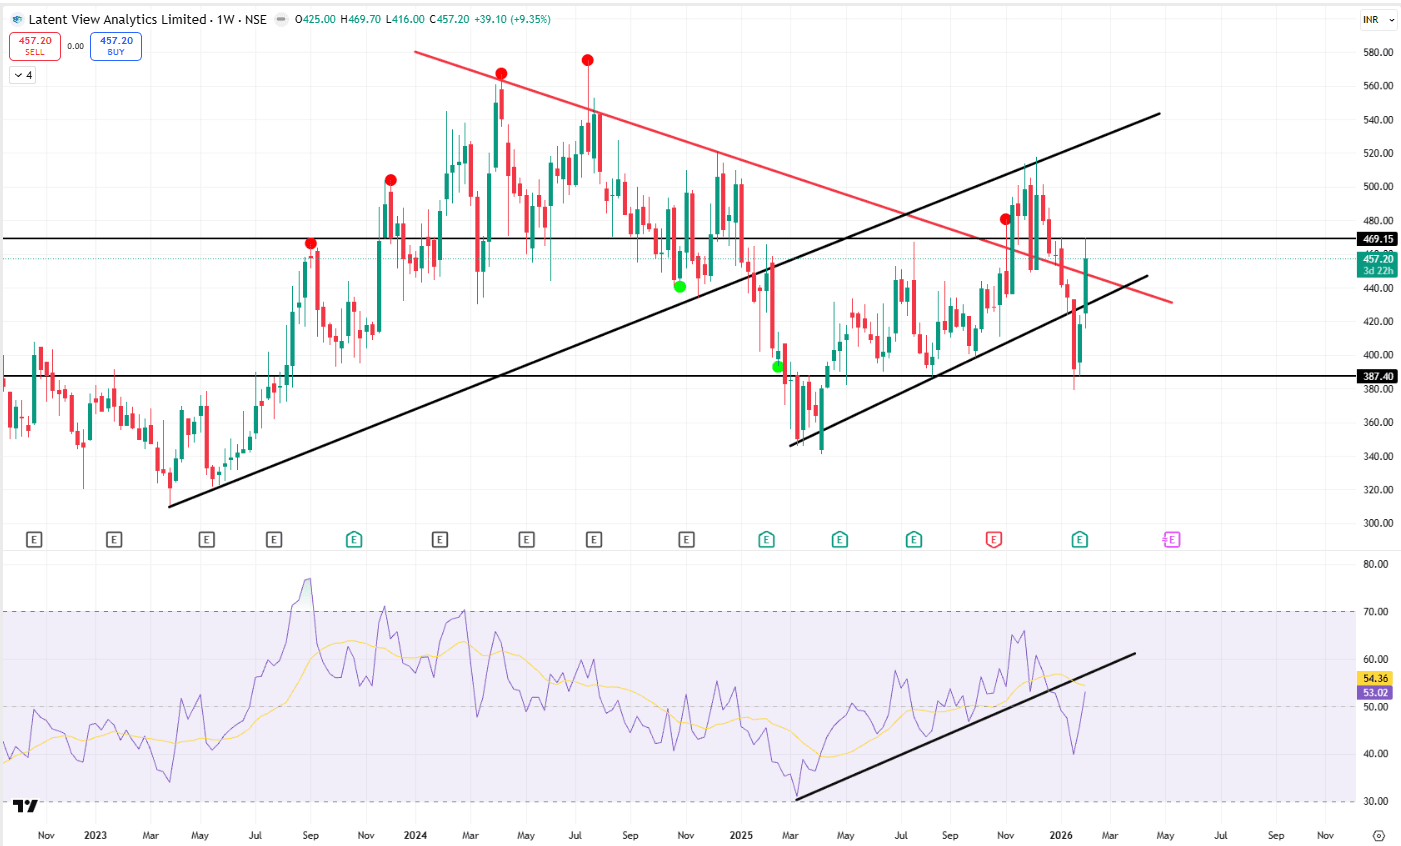
Latent View Analytics Ltd – Weekly Chart | Rising Structure Meets Overhead Supply
LATENTVIEW
Weekly structure shows recovery from a base near ₹350–360, followed by a rising channel. Price recently faced rejection near a declining trendline from prior highs, indicating overhead supply still active. 📐 Price Structure Medium-term trend remains upward above the rising support line from the 2023 lows. Recent candles show higher volatility near the channel mid-zone, suggesting an ongoing tussle between buyers and sellers. 🧱 Key Levels Immediate Resistance: ₹465–475 zone (horizontal supply + trendline overlap). Near Support: ₹395–400 (channel support and prior demand). Major Support: ₹370–380 (previous swing base). Above Resistance Zone: Sustained acceptance above ₹480 would improve structural strength. 📊 RSI Observations RSI is holding above 50, maintaining a positive bias. Higher lows on RSI align with the rising price structure, indicating underlying momentum support. No clear bearish divergence at present; momentum remains constructive but not impulsive. 📦 Volume Behavior Volume expansion seen on the recent recovery leg. Pullbacks are occurring on relatively lower volumes, keeping the structure intact. 🧩 Overall Reading The stock is in a consolidation-within-uptrend phase. Holding above ₹395 keeps the bullish structure valid, while repeated rejections near ₹470 suggest a need for consolidation before further directional clarity. Price is compressing between rising support and overhead resistance, making this a technically sensitive zone. 📢 Disclaimer: For educational and technical analysis purposes only; not investment advice. 👤 Rajneesh Sharma – SEBI Registered Research Analyst (INH000020332)

#TechnicalViews
Screenshot 2026-02-02 180826.png
564 likes·74 comments