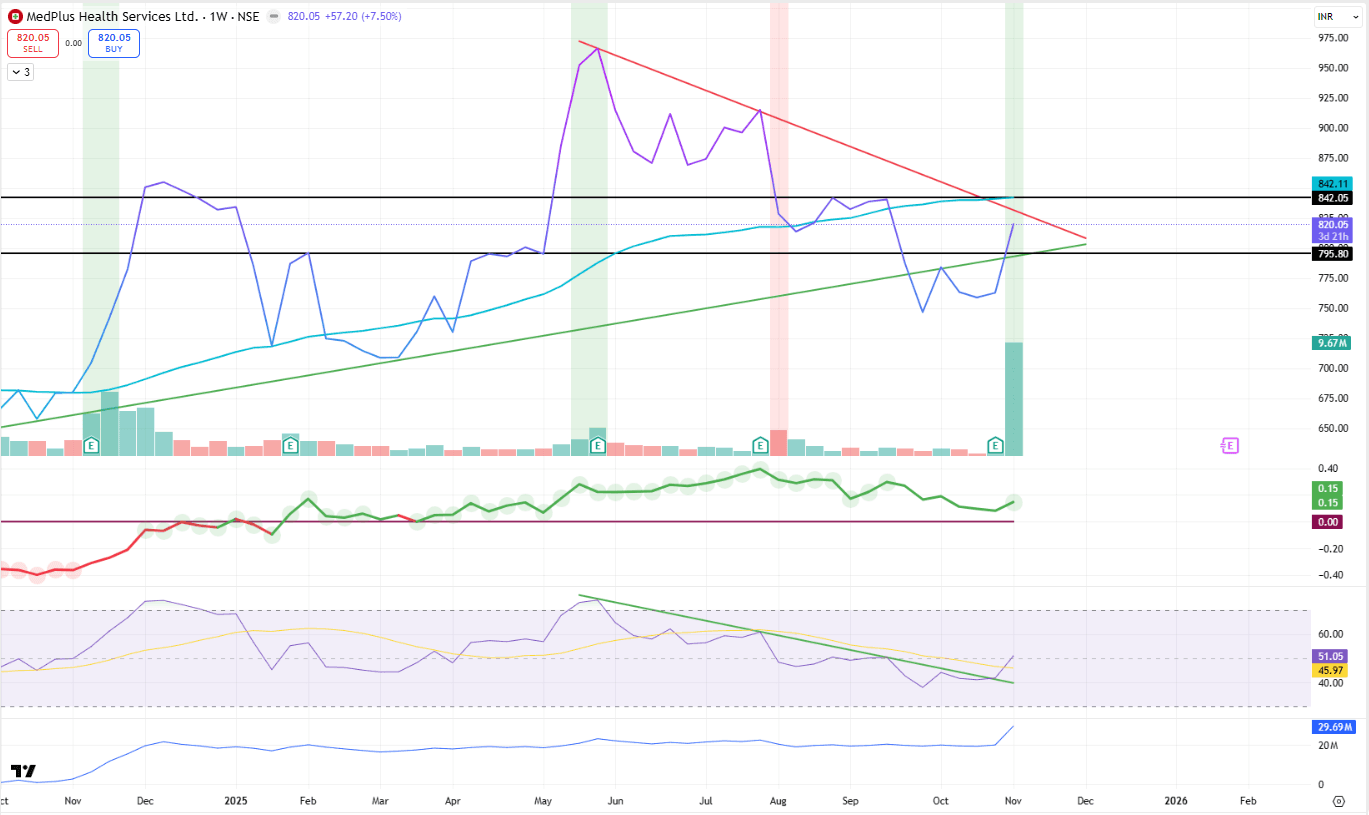
MedPlus is showing early breakout signs from a well-defined symmetrical triangle pattern, supported by strong volume and a decisive move above the 30-week SMA. This technical alignment suggests the potential start of a trend continuation phase, provided there’s sustained follow-through.
🔹 Technical Overview
Pattern: Symmetrical Triangle (Compression Phase)
Breakout Zone: ₹820–₹842
Immediate Resistance: ₹842 (horizontal resistance and upper triangle trendline)
Support Zone: ₹795–₹800 (triangle lower boundary and 30 SMA retest area)
Volume: Sharp spike this week (highlighted in green) — indicative of institutional participation.
RSI: Turning up from below 45, now near 51 — breaking RSI downtrend (green line) and showing bullish momentum shift.
OBV: Rising steadily, confirming accumulation.
Relative Strength (RS): Starting to move above baseline — potential outperformance signal.
🔹 Interpretation
⚙️ The stock is attempting a symmetrical triangle breakout after months of compression between converging trendlines.
⚙️ Price closing above the 30-week SMA and upper trendline with volume confirmation would strengthen the breakout case.
⚙️ RSI trendline break indicates improving momentum and early entry of buyers.
🟢 View
If follow-through buying sustains with volume above 9–10M, the stock may confirm breakout continuation toward ₹880–₹920 in the short-to-medium term.
⚠️ On the downside, failure to hold ₹795 could lead to a retest of the triangle base near ₹760.
📢 Disclaimer: For educational and technical analysis purposes only; not investment advice.
👤 Rajneesh Sharma – SEBI Registered Research Analyst (INH000020332)