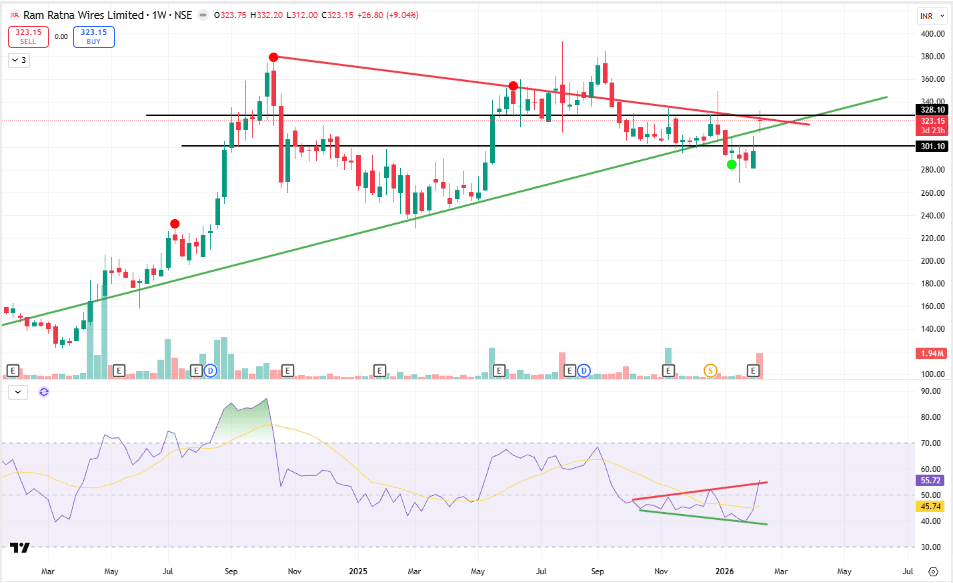
Ram Ratna Wires Ltd (Weekly Chart): Range Interaction Within a Rising Long-Term Structure
RAMRAT
1. Price Structure
The stock remains in a broader rising structure, defined by higher lows over the long term. Recent price action shows consolidation after a prior advance, with no clear expansion in volatility, indicating a pause rather than a trend reversal.
2. Trendlines
An ascending trendline from earlier swing lows continues to act as structural support. Price is simultaneously capped by a descending trendline from prior highs, forming a contracting range that reflects supply–demand balance.
3. Key Levels (Chart Observations)
A well-defined horizontal support zone has repeatedly attracted price reactions, reinforcing its importance. Overhead, prior swing highs and the descending trendline form a layered resistance zone. These levels highlight historical price sensitivity.
4. Momentum (RSI)
Weekly RSI is positioned in the mid-range, avoiding both overbought and oversold conditions. RSI has formed a mild higher low while price remains range-bound, suggesting stabilising momentum rather than directional strength.
5. Volume Behaviour
Volume has tapered during consolidation compared to earlier expansion phases. This contraction indicates reduced participation and absence of aggressive accumulation or distribution.
6. Overall Observation
The chart reflects a stock holding its long-term structural support while consolidating below resistance. Price, momentum, and volume together point to equilibrium and compression rather than trend continuation or breakdown.
📢 Disclaimer: For educational and technical analysis purposes only; not investment advice.
👤 Rajneesh Sharma – SEBI Registered Research Analyst (INH000020332)