Reliance Industries Ltd – Weekly Structure Under Test After RSI Divergence
RIIL
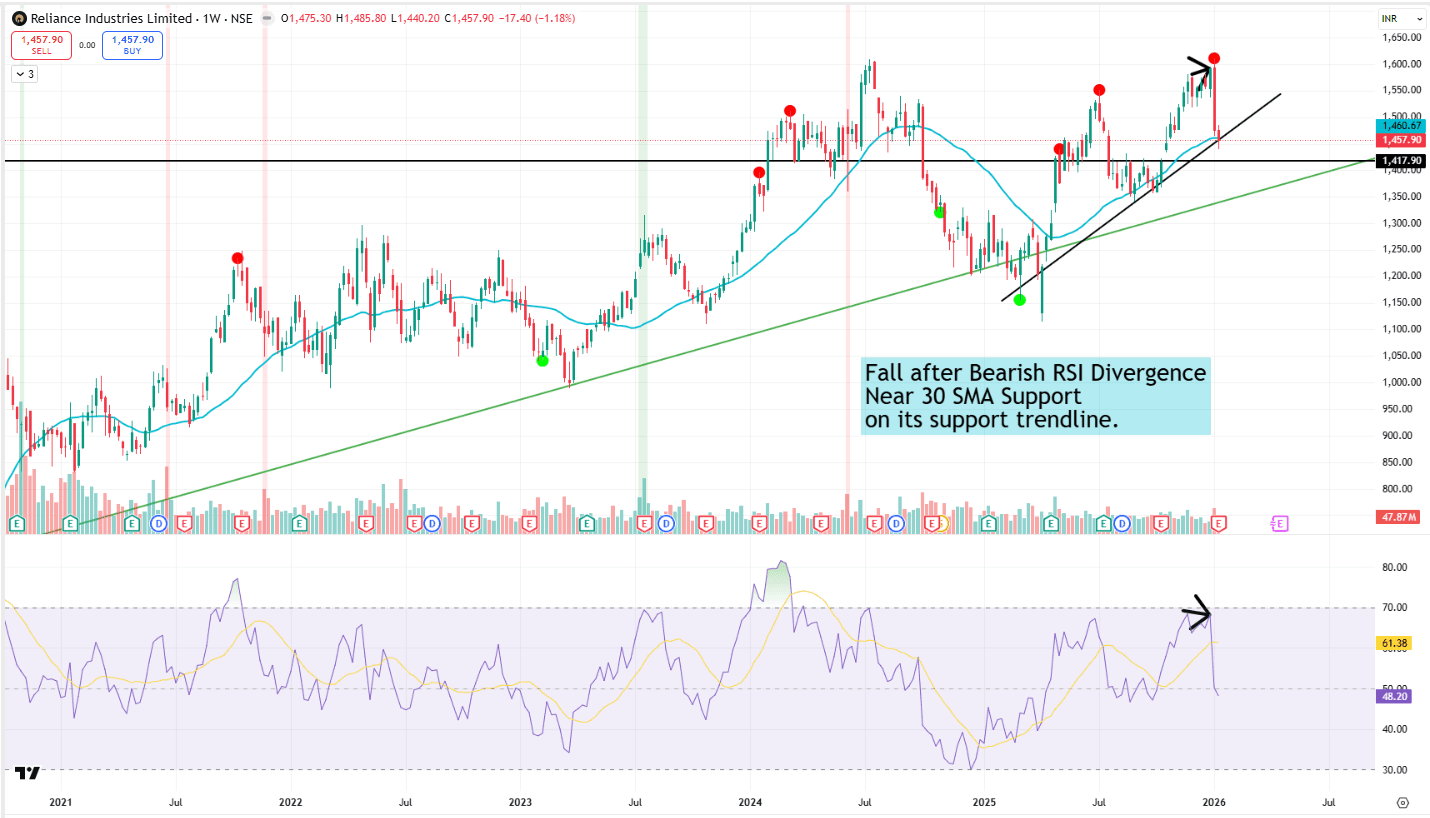
Reliance has seen a sharp pullback after forming a bearish RSI divergence near the recent highs. Price has corrected from the upper resistance band and is now interacting with an important confluence support zone formed by the rising long-term trendline and the 30-week SMA.
Price Action Observations
The recent decline appears controlled rather than impulsive, suggesting profit-booking instead of trend breakdown.
The stock is currently holding above the rising support line near the ₹1,420–1,440 zone, which has acted as a demand area in past corrections.
Any sustained move below this zone could open room for deeper consolidation.
Momentum & RSI Readings
RSI cooled off after staying in the upper range and has moved closer to neutral levels.
This reset improves risk-reward if price stabilizes, but RSI needs to hold above 45–50 to avoid further weakness.
The earlier bearish divergence has already played out partially via the recent fall.
What to Watch Going Ahead
Support holds + RSI stabilizes → consolidation with potential for trend continuation.
Support breaks decisively → probability of extended correction increases.
Upside strength will require price to reclaim recent swing highs with improved momentum.
Summary View
Reliance is at a make-or-break zone on the weekly chart. The broader trend remains intact for now, but follow-through strength will depend on how price behaves around the 30-week SMA and rising trendline support.
📢 Disclaimer: For educational and technical analysis purposes only; not investment advice.
👤 Rajneesh Sharma – SEBI Registered Research Analyst (INH000020332)