1 hour ago · SEBI Registration INH000032382
SEBI Registration INH000032382 · 1 hour ago
Axis Bank Ltd Techincal Outlook after Q2FY27 Result
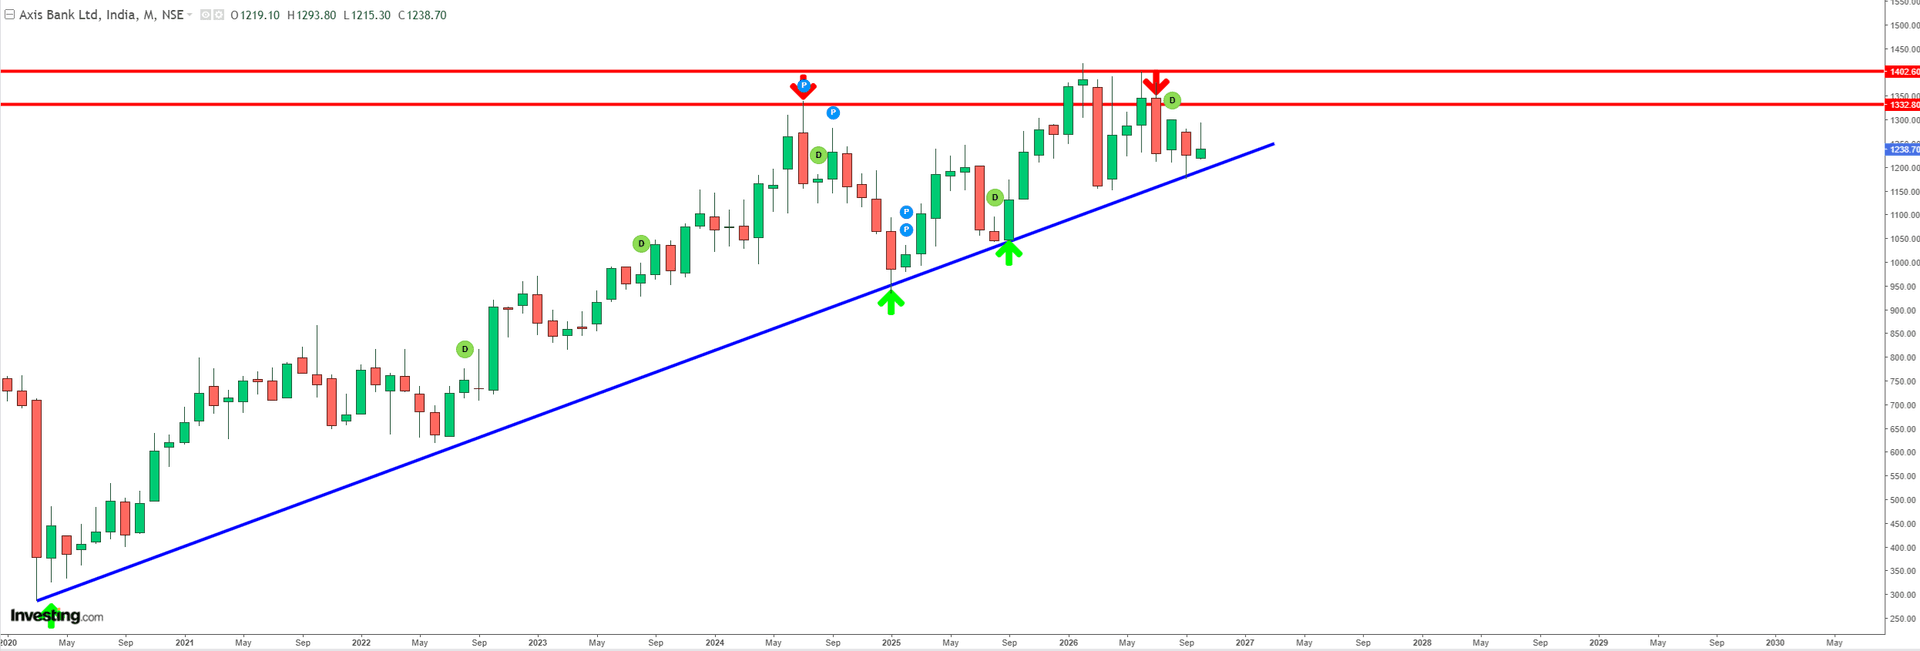
Axis Bank Ltd. is showing signs of technical weakness on the monthly chart after facing repeated selling pressure in the ₹1,350–₹1,400 resistance zone. The stock appears to be developing a potential double-top formation, indicating difficulty in sustaining upward momentum at higher levels. The subsequent correction has brought the price closer to its crucial rising blue trendline, which has acted as long-term support during the broader uptrend. The immediate technical outlook remains cautious as the stock attempts to sustain above this important trendline. As long as the support structure remains intact, consolidation or a recovery towards the overhead resistance zone cannot be ruled out. However, a decisive monthly close below the rising trendline could signal a breakdown of the prevailing bullish structure, potentially triggering fresh selling pressure and accelerating the corrective move in the coming months. Key Technical Levels: - Major Resistance: ₹1,350–₹1,400 - Immediate Resistance: Around ₹1,330 - Critical Support: Rising trendline near ₹1,200–₹1,220 (approximate chart-based estimate) - Bearish Trigger: Confirmed monthly close below the rising trendline. - Bullish Confirmation: Sustained breakout above ₹1,400. Research Analyst's View: Investors should remain cautious near the overhead resistance zone and closely monitor the long-term trendline for directional confirmation. A confirmed breakdown could open the door to a deeper correction, whereas sustained strength above ₹1,400 would weaken the double-top hypothesis. The pattern is not confirmed yet; price action around the support zone will be crucial in determining the next major trend.