19 hours ago · SEBI Registration INH000032382
SEBI Registration INH000032382 · 19 hours ago
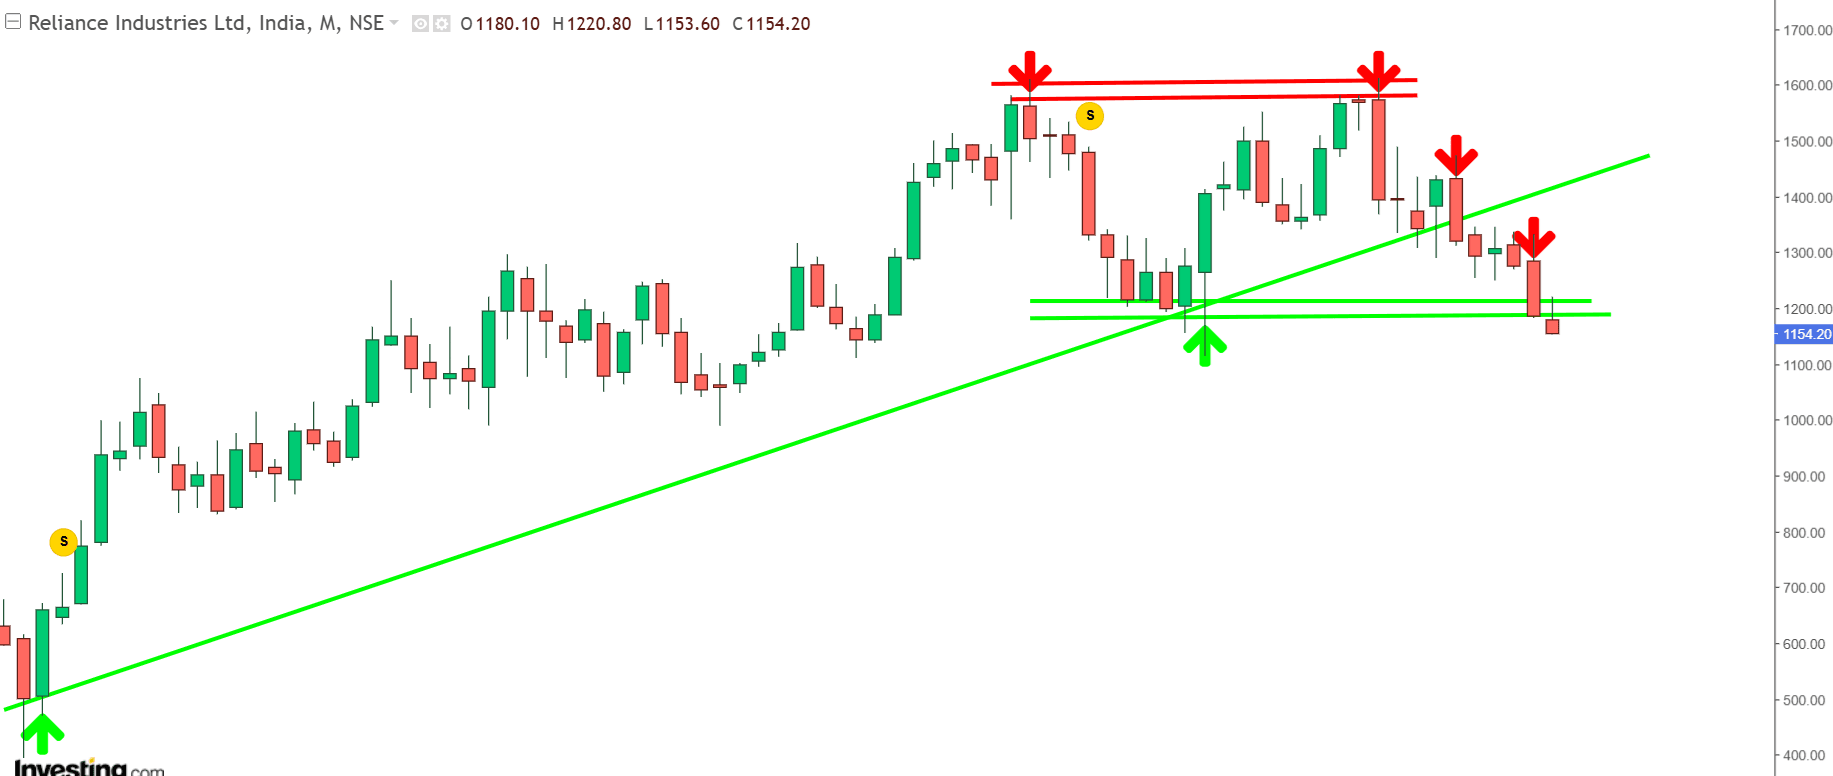
Reliance Industries Ltd Long Term Techical Outlook
Reliance Industries Ltd has witnessed a significant deterioration in its long-term technical structure, with the monthly chart indicating a decisive shift from a major bullish trend towards a bearish-to-sideways phase. The stock broke its long-term rising trendline in May 2026, signalling weakening bullish momentum and a loss of structural support. Subsequently, repeated failures near the ₹1,400–₹1,450 resistance zone resulted in lower highs, reflecting persistent selling pressure. The crucial horizontal support zone around ₹1,180–₹1,220 has now witnessed a decisive breakdown, further confirming the deterioration in the stock’s technical outlook. The latest price action indicates that sellers are gaining control, while the stock struggles to sustain buying interest at lower levels. The breakdown of both the rising trendline and the horizontal support zone represents a significant technical setback, increasing the probability of continued weakness over the coming months. Although intermittent pullbacks may emerge after the sharp decline, such recoveries should be treated as corrective rebounds within the broader downtrend rather than evidence of an immediate bullish reversal. The broken ₹1,180–₹1,220 support zone may now act as resistance during recovery attempts, while higher levels could attract fresh selling pressure. Over the coming months, Reliance Industries may witness range-bound consolidation interspersed with volatile corrective rallies. However, the broader technical outlook remains vulnerable to further downside pressure. A sustained recovery above key resistance levels and a meaningful improvement in the monthly price structure would be necessary to signal a trend reversal. Until then, Reliance Industries is likely to remain in a bearish-to-sideways phase, with potential for continued underperformance.