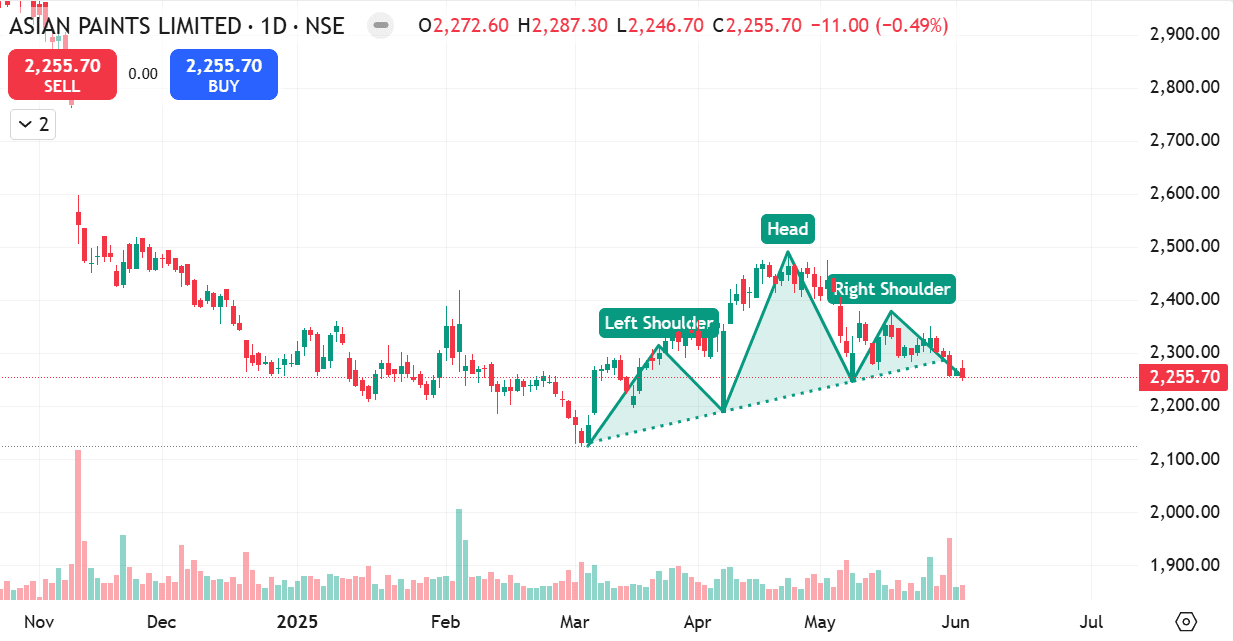
Asian Paints: More Pain Ahead?
Asian Paints is already in a strong downtrend, and now it's showing signs of continuing that fall. Here's what’s happening: Head and Shoulders Pattern – Explained: A Head and Shoulders is a chart pattern that usually signals a trend reversal. It looks like: • Left Shoulder (a small peak) • Head (a bigger peak) • Right Shoulder (another small peak) • Neckline – the support line connecting the lows When price breaks below the neckline, it's a bearish signal – price is likely to fall further. Why this one matters: In Asian Paints: • A clear H&S pattern has formed after a small bounce • The neckline is broken with volume • It's happening within a larger downtrend This strengthens the bearish case — it's not a top reversal, it's a continuation pattern in this context. Trade Setup (For educational purpose only): • Entry: Below neckline breakout (Already broken) Around ₹2,260 • Stop Loss: Above right shoulder Around ₹2,390 • Target: Measure height from head to neckline Approx target = ₹2,260 - (₹2,490 - ₹2,260) = ₹2,030 Final Word: This is a textbook bearish setup — Asian Paints looks set to continue its southward journey. But always manage risk. No pattern is 100% guaranteed. Trade with a plan, not emotion.