11th Apr 2025 · SEBI-Registered Analyst
Trade Milaan with Sasikumar · 11th Apr 2025
Chart Analysis – Dixon Technologies
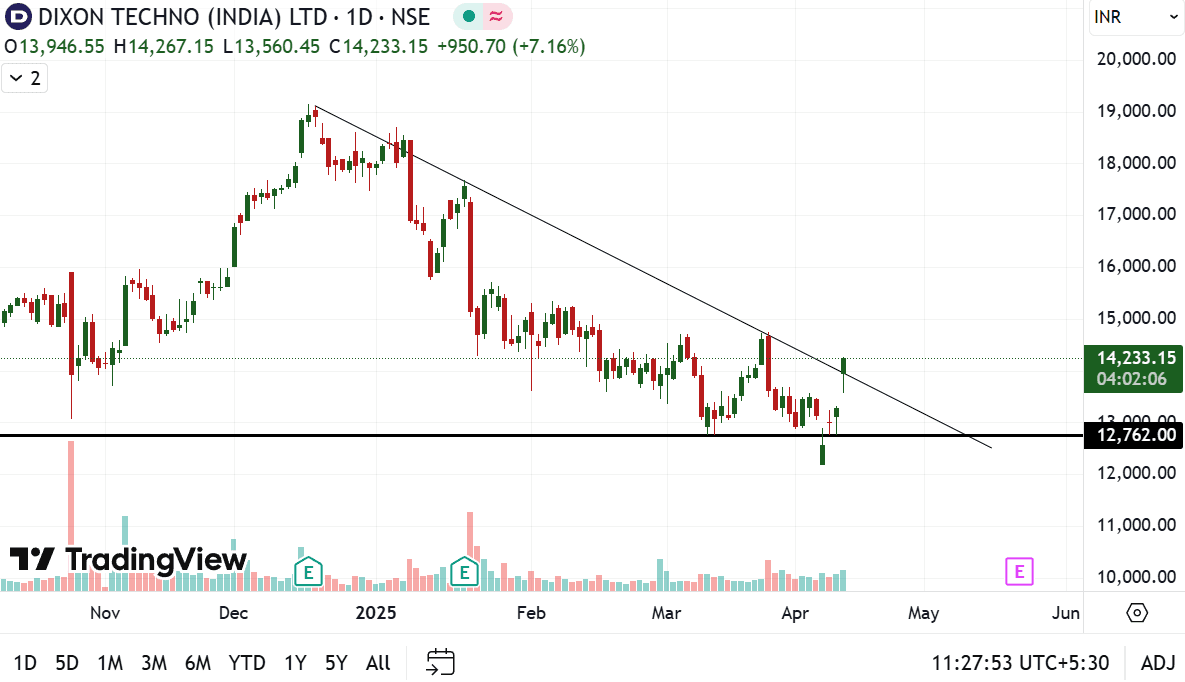
Chart Analysis – Dixon Technologies (NSE: DIXON) Timeframe: Daily (1D) Date: April 11, 2025 ✅ Downtrend line broken: The stock was respecting a downward sloping trendline for months. On today's candle, it's clearly broken above it with strong price action. ✅ Big green candle (+6.68%) A strong bullish candle is trading above the trendline, showing solid buying interest. ✅ Volume confirmation: Check the volume bar – it’s higher than average, which adds strength to the breakout. 🔍 What Does This Mean? This breakout suggests that the downtrend might be ending, and a potential short-term reversal or new uptrend could be starting. 📏 A trendline breakout is often a sign of changing sentiment – from bearish to bullish. 📈 A strong breakout usually needs volume confirmation, which Dixon has shown today. 🕰 Wait for a follow-up candle (preferably another green close) to confirm it's not a false breakout. 📌 Caution: Don’t chase blindly. 👉 Let the price hold above the trendline for a session or two. 👉 Watch for retest levels (around ₹13,800–14,000). 👉 Use proper risk management if entering.