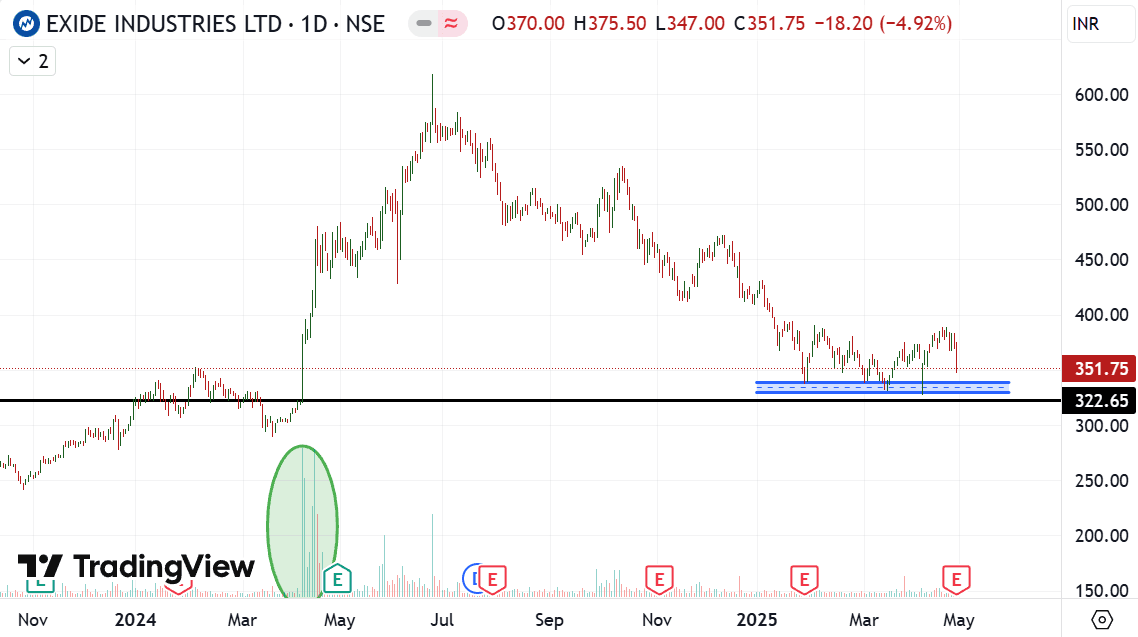
Exide Industries Ltd – Technical Analysis (as of ₹351.75)
Key Observations from Chart: 1. Massive Breakout in April 2024: • Huge bullish momentum with surging volume (suggesting institutional buying). • Up move from around ₹321 to ₹467+ in just days, forming the base of the current long-term structure. 2. All-Time High at ₹620.35 in June 2024: • Followed by consistent lower highs and lower lows, forming a broad downtrend channel. 3. Current Support Zone: ₹328–₹340: • Price has retested this zone 4 times. • Each time, buying pressure stepped in, visible from the long wicks and stabilizing candles. • This confirms strong demand, likely from institutions defending their original positions. 4. Volume Analysis: • Volume has dried up during the downtrend — typical when strong hands accumulate silently. • Volume spikes tend to appear around support, not at breakdowns — a bullish sign. What This Implies: • The ₹328–₹340 zone is suggesting institutional accumulation level. • The fact that price is not breaking down despite broader selling implies smart money is active here. • If price holds this zone again and breaks above ₹370–₹380 with increased volume, it can kickstart a new uptrend. • Close below ₹321 with volume would signal weakness.