16th Apr 2025 · SEBI-Registered Analyst
Trade Milaan with Sasikumar · 16th Apr 2025
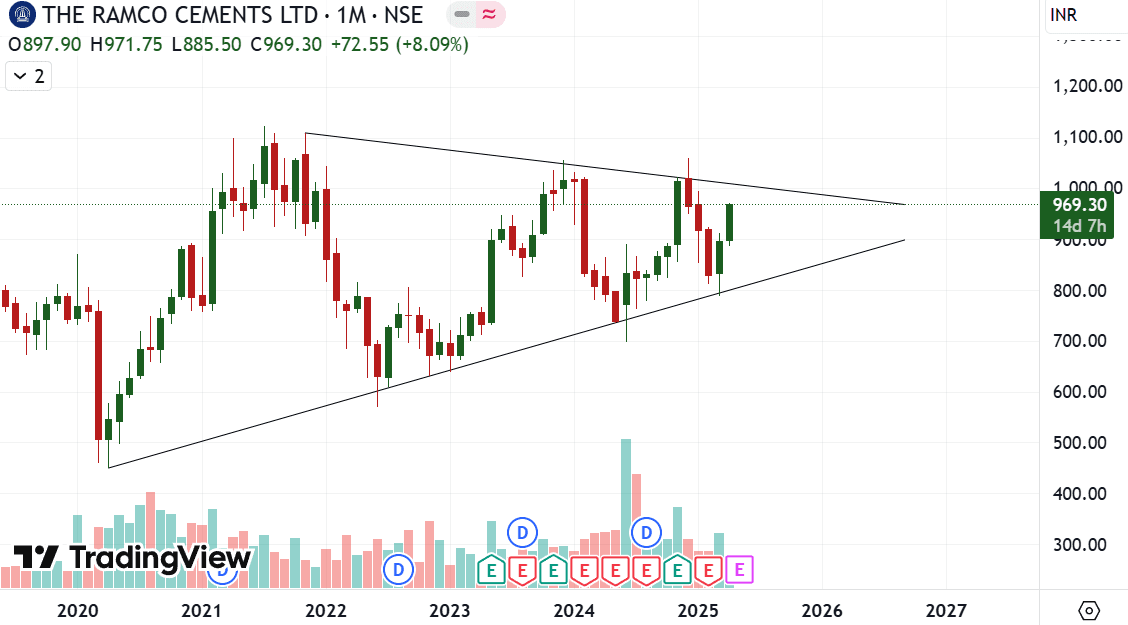
Ramco Cements (Monthly) - Stock Chart Breakdown 16-04-2025
Pattern Watch: Symmetrical Triangle Ramco Cements is forming a symmetrical triangle on the monthly chart – a pattern that shows price is getting squeezed between higher lows and lower highs. This usually means a big move is coming soon – but the direction can be either side. Key Points: Support line: Price is making higher lows, showing buyers are stepping in at better levels. Resistance line: Price is also making lower highs, meaning sellers are still active on the upside. A breakout on either side (up or down) can bring strong momentum. If it breaks upward: We might see a rally toward ₹1100+ If it breaks downward: It could dip toward ₹800 or lower Wait for a clear breakout with volume before taking any position.