📉 Nifty 50 Under Pressure: Charts and FII Data Signal Caution Ahead
India’s benchmark index **Nifty 50** is showing signs of near-term weakness as heavy foreign institutional selling aligns with a breakdown in key technical levels. Recent market action suggests investors may need to remain cautious in the short term.
📊 **Institutional Activity Turning Negative**
Foreign Institutional Investors (FIIs) have been aggressive sellers in the cash market. Over the last few sessions, FIIs have sold nearly **₹29,000+ crore worth of equities**, including major selling of **₹8,752 crore on March 4 and ₹6,030 crore on March 6**. Persistent outflows from global investors often create pressure on benchmark indices, particularly when markets approach critical support zones.
📉 **Technical Structure Weakening**
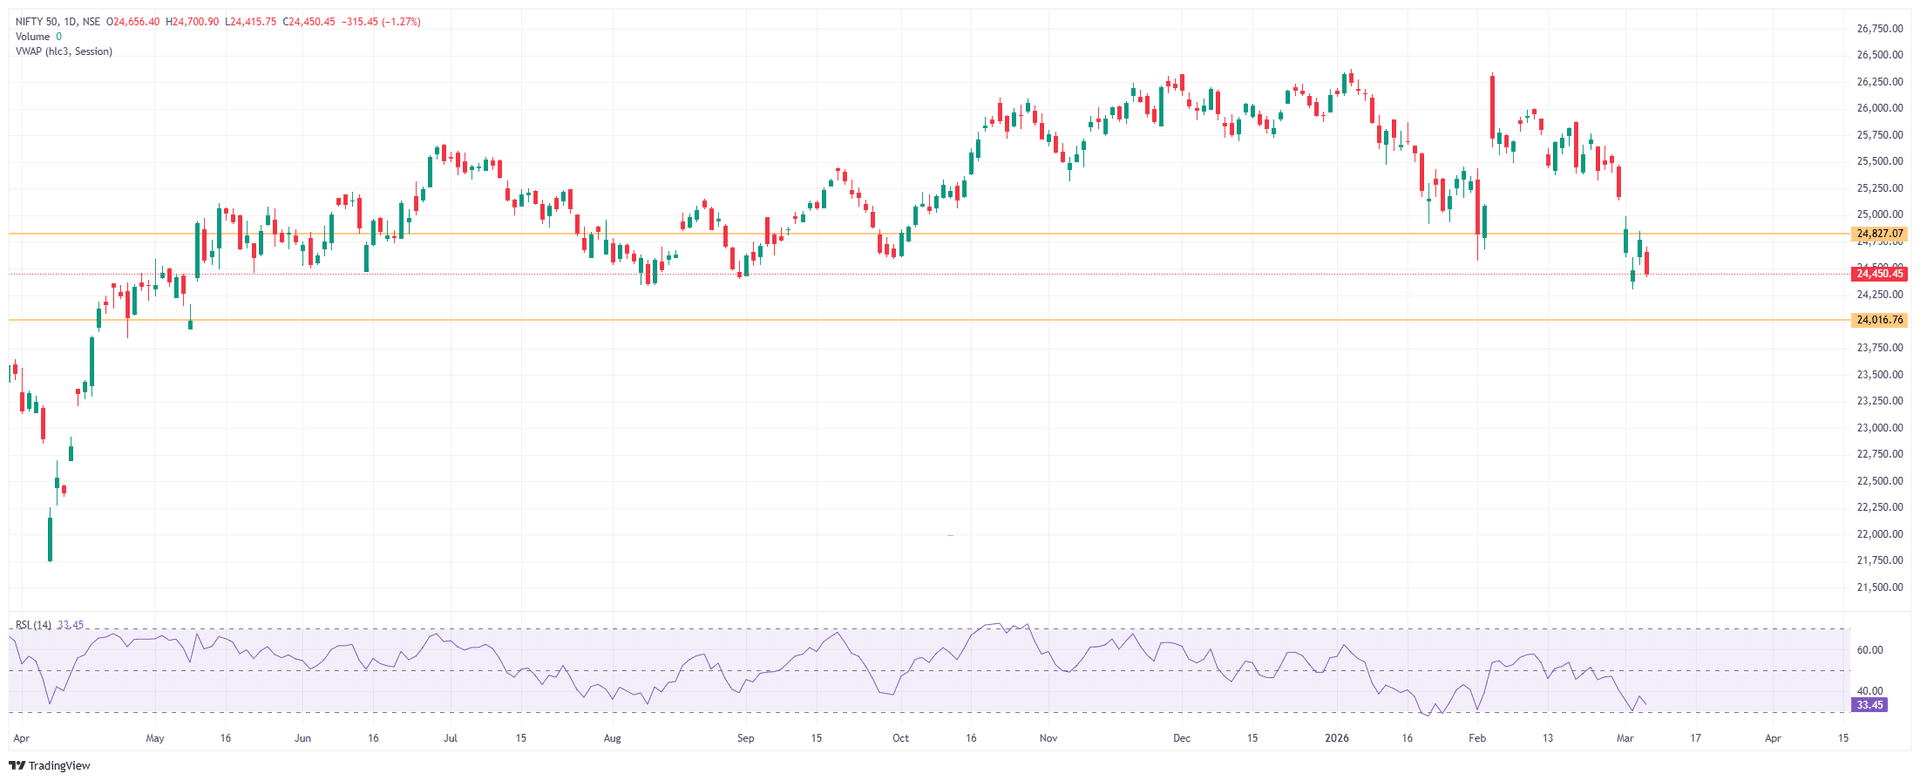
From a technical perspective, Nifty has **slipped below the important 24,800 support zone**, which previously acted as a strong demand area. The index is currently trading around **24,450**, with price structure forming **lower highs and lower lows**, indicating short-term bearish momentum.
📍 **Key Levels to Watch**
🔴 Resistance: **24,800 – 25,000**
🟢 Immediate Support: **24,000**
🟢 Next Support Zone: **23,700**
Momentum indicators also reflect weakness, with the **daily RSI near 33**, approaching oversold territory. While this may trigger a **short-term relief bounce**, the broader trend suggests a **sell-on-rise environment** until the index reclaims higher resistance levels.
⚠️ **Disclaimer:** This post is for educational purposes only and should not be considered investment advice.
👍 Like, share, and follow for more market insights and research updates.