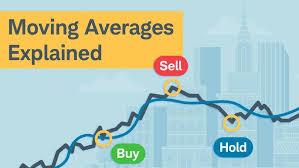
What are moving averages in stock market?
**Moving averages** are a crucial tool in technical analysis, used to smooth out price data over a specific time period to identify trends and reduce market noise. They are widely used to understand price direction and potential buying or selling signals.
There are two main types of moving averages:
1. **Simple Moving Average (SMA)**: This is the average of a stock’s closing prices over a set number of periods, such as 50 days or 200 days. It’s easy to calculate and provides a clear view of the overall trend, but it may lag behind because it gives equal weight to all past data points, including older ones.
2. **Exponential Moving Average (EMA)**: Unlike the SMA, the **EMA** gives more weight to recent prices, making it more responsive to current market conditions. The EMA is often used for short-term trends and is popular among traders looking to react faster to price changes.
Moving averages are key for identifying **trends**—a price above the moving average indicates an uptrend, while a price below suggests a downtrend. They also act as dynamic support or resistance levels. A **bullish crossover** occurs when a shorter-term moving average crosses above a longer-term one, signaling potential buying opportunities, while a **bearish crossover** indicates a selling opportunity.