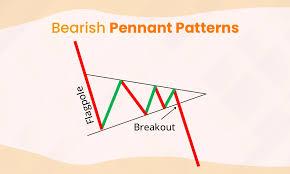
What is Bearish Pennant in technical chart pattern?
A **Bearish Pennant** is a continuation chart pattern that typically occurs during a downtrend, signaling that the price is likely to continue lower after a period of consolidation. It consists of two main phases:
1. **Flagpole**: A sharp, downward price movement that forms the initial part of the pattern. This represents strong selling pressure.
2. **Consolidation**: After the flagpole, the price consolidates within two converging trendlines, typically with lower highs and higher lows, forming a small symmetrical triangle or pennant shape.
3. **Breakdown**: The pattern is confirmed when the price breaks below the lower trendline, signaling a potential continuation of the downward trend.
### Key Features:
- **Volume**: Volume generally decreases during the consolidation phase and then spikes when the breakdown occurs.
- **Trend**: A Bearish Pennant occurs in an existing downtrend, reinforcing the idea that the price will likely continue lower.
- **Duration**: It typically lasts for several days or weeks, depending on the timeframe.
### Trading Strategy:
- **Entry**: Traders enter when the price breaks below the lower trendline of the pennant, with an increase in volume.
- **Stop-Loss**: Place a stop-loss above the upper trendline or recent swing high.
- **Profit Target**: Measure the height of the flagpole and project it downward from the breakdown point.
A Bearish Pennant indicates that the market is preparing for a potential continuation of a downtrend.