What is Bullish Pennant in technical chart pattern?
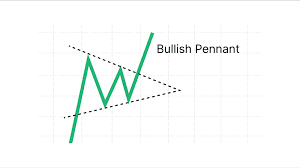
A **Bullish Pennant** is a **continuation chart pattern** that signals the continuation of an uptrend. It forms after a **strong upward price movement** (the flagpole) followed by a period of **consolidation** where the price moves within a narrowing range, forming a **symmetrical triangle** (the pennant). This consolidation represents a temporary pause in the trend, where price swings become smaller, with lower highs and higher lows.
To identify a Bullish Pennant:
1. **Uptrend (Flagpole)**: A sharp, vertical price movement indicates a strong bullish trend.
2. **Consolidation (Pennant)**: After the flagpole, the price enters a consolidation phase where trendlines converge, forming the pennant shape.
3. **Breakout**: The pattern is confirmed when the price breaks above the upper trendline of the pennant with **increased volume**, signaling a continuation of the uptrend.
Traders typically enter the market when the price breaks out above the pennant's upper trendline. A price target can be estimated by measuring the height of the flagpole and projecting that upward from the breakout point. Proper risk management, such as setting a stop-loss below the pennant's lower trendline, is essential for trading the pattern successfully.
The Bullish Pennant pattern is effective when volume confirms the breakout, suggesting the trend will continue.