What is candlestick in share market?
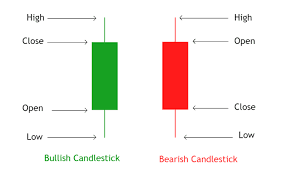
A **candlestick** in the stock market is a graphical representation used to display the price movement of an asset over a specific time period. Unlike line charts, which only show closing prices, candlestick charts provide more information by displaying four key price points: the **open**, **high**, **low**, and **close**.
A candlestick consists of a **body** and **wicks** (also known as **shadows**). The **body** represents the range between the opening and closing prices. If the closing price is higher than the opening price, the candlestick is typically shown as hollow or green, indicating a bullish trend. Conversely, if the closing price is lower than the opening price, the candlestick appears filled or red, indicating a bearish trend.
The **wicks** represent the highest and lowest prices reached during the period. The **upper wick** shows the highest price, while the **lower wick** shows the lowest price.
Candlestick patterns, formed by one or more candlesticks, help traders predict market behavior. Common patterns include:
- **Doji**: When the open and close are nearly the same, signaling indecision.
- **Hammer**: A candlestick with a small body and a long lower wick, often signaling a potential reversal after a downtrend.
Traders use candlestick charts to analyze market sentiment, identify trends, and forecast price movements.