What is Down Three Method Pattern?
The **Down Three Method** is a **bearish continuation pattern** used in technical analysis to indicate that a downtrend is likely to resume after a brief consolidation or upward pullback. It typically forms during an established downtrend and suggests that the market is experiencing a temporary pause before continuing its downward movement.
### Pattern Structure:
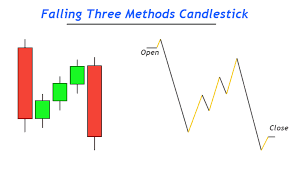
The pattern consists of **five candlesticks**:
1. The first candlestick is a **long bearish (red)** candlestick, signaling the start of the downtrend.
2. The next **three candlesticks** are smaller **bullish (green)** or **neutral (doji)** candlesticks, indicating a short-term upward correction or consolidation. These candlesticks typically remain within the range of the first bearish candlestick.
3. The fifth candlestick is another **long bearish** candlestick, which closes below the low of the first candlestick, confirming the continuation of the downtrend.
### Confirmation:
The pattern is confirmed when the **fifth candlestick** closes below the low of the first candlestick, indicating the resumption of downward momentum.
### Volume:
Volume should increase during the formation of the pattern, especially during the fifth candlestick, confirming renewed selling pressure.
The **Down Three Method** is a strong bearish signal, suggesting that the brief consolidation is over and the asset is likely to continue its downward movement. However, confirmation through volume and price action is essential to avoid false signals.