What is downside tasuki gap in technical analysis ?
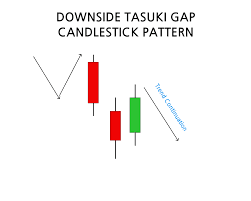
The **Downside Tasuki Gap** is a bearish continuation pattern in technical analysis that occurs during a downtrend, signaling the likelihood of continued downward movement after a brief pause or retracement.
### Key Features of a Downside Tasuki Gap:
1. **Gap Down**: The pattern starts with a **down gap**, where the price opens lower than the previous day’s close, indicating strong selling pressure.
2. **Bearish Candlestick**: Following the gap, a **bearish candlestick** (usually red or black) forms, closing lower than the gap’s opening price, confirming the continuation of the downtrend.
3. **Bullish Retracement**: After the bearish candlestick, a **bullish candlestick** (green or white) forms, opening within the gap but closing lower than the first candlestick’s close. This shows a brief upward movement, but it doesn’t fully fill the gap.
4. **Continuation of Downtrend**: The key feature is that the bullish candlestick does not close the gap, suggesting that the market remains in a strong downtrend.
### Significance:
The **Downside Tasuki Gap** indicates that after a short-term retracement, the bears (sellers) are still in control, and the downtrend is likely to continue. Traders often interpret this as a signal to enter or add to short positions, as the gap and price action confirm the ongoing bearish trend. However, confirmation through volume and other indicators is important.