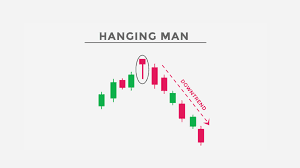
What is Hanging man candle in technical analysis?
The **Hanging Man** is a bearish candlestick pattern that appears after an uptrend and signals a potential trend reversal or weakening of the current bullish momentum. It consists of a single candlestick with specific features: a small body near the top of the price range, a long lower shadow, and little or no upper shadow.
1. **Small Body**: The body (difference between open and close) is small, which can be either bullish (close > open) or bearish (close < open).
2. **Long Lower Shadow**: The lower shadow is significantly longer than the body, usually at least twice the size, showing that sellers drove the price down during the session, but buyers managed to push it back up.
3. **Minimal Upper Shadow**: There is little or no upper shadow, meaning that the price didn’t rise much above the open.
The Hanging Man indicates that, although buyers were initially in control, the bears (sellers) took control and pushed the price lower, suggesting a potential reversal. While the pattern itself is a warning, confirmation is essential. Traders often wait for a bearish candlestick after the Hanging Man to confirm the trend reversal.
In conclusion, the Hanging Man is a bearish signal in technical analysis, especially when confirmed by subsequent price action, indicating that an uptrend may be nearing its end.