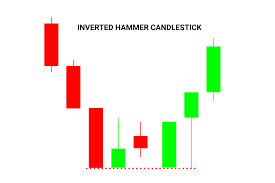
What is Inverted Hammer candlestick pattern in technical analysis?
The **Inverted Hammer** is a candlestick pattern used in technical analysis to indicate a potential reversal in a downtrend. It’s a single candlestick formation with specific characteristics: a small body, a long upper shadow (typically at least two to three times the size of the body), and a small or absent lower shadow. The small body suggests little price movement between the open and close, while the long upper shadow shows that buyers tried to push the price higher, but sellers eventually pushed it back down.
This pattern is most significant when it appears after a prolonged downtrend. The long upper shadow reflects rejection of lower prices, indicating that the selling pressure may be weakening, and the bulls are gaining control. However, the Inverted Hammer alone is not a definitive signal of reversal; traders often wait for confirmation in the form of a bullish candlestick that closes higher than the high of the Inverted Hammer.
While the Inverted Hammer can signal a reversal from bearish to bullish, its reliability improves with higher volume and a follow-up bullish candle. Thus, it is crucial to assess the broader market context and wait for confirmation before making trading decisions.