WHAT IS MORNING STAR IN TECHNICAL ANALYSIS?
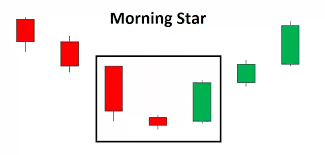
In **technical analysis**, the **Morning Star** is a bullish candlestick pattern that signals a potential reversal from a downtrend to an uptrend. It is a three-candle pattern, typically appearing at the bottom of a downtrend, and indicates a shift in market sentiment from bearish to bullish.
### The components of the Morning Star pattern:
1. **First Candle**: A long bearish (red or black) candle, showing strong downward momentum.
2. **Second Candle**: A small-bodied candle, either bullish or bearish, known as the "star." It represents indecision in the market, as the price opens and closes within the range of the first candle, indicating a slowdown in the downtrend.
3. **Third Candle**: A long bullish (green or white) candle, confirming the reversal. This candle should close well above the midpoint of the first candle, showing strong upward momentum and the beginning of a potential uptrend.
### Interpretation:
- The **Morning Star** pattern suggests that after a downtrend, the bears are losing control, and the bulls are starting to take over.
- The pattern is most reliable when it occurs at significant support levels, such as a previous low or trendline, adding to the likelihood of a successful reversal.
Traders often use the Morning Star as a signal to enter long positions, expecting a bullish move. However, it's important to confirm the pattern with other indicators or chart patterns to increase the probability of success.