What is Price action in technical analysis?
Price action in technical analysis is the study of past price movements to make predictions about future price trends. It involves analyzing raw price data, often represented through candlestick charts, without relying on indicators or oscillators. The core idea is that all relevant market information is already reflected in the price itself, and by studying price patterns, traders can make informed decisions.
Key components of price action include:
1. **Candlestick Patterns**: Specific formations, like engulfing patterns or doji candles, provide insights into market sentiment and potential price reversals.
2. **Support and Resistance**: These are critical levels where price has historically reversed or stalled, helping traders predict where future price movements may slow or reverse.
3. **Trends**: Identifying whether the market is trending up, down, or sideways is essential. Traders look to trade in the direction of the trend for higher probability setups.
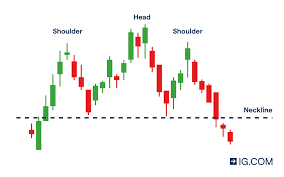
4. **Chart Patterns**: Common patterns, such as head and shoulders, triangles, or double tops/bottoms, are used to forecast potential price movements.
5. **Price Levels**: Significant price points like swing highs and lows, which are often used as entry or exit points.
In essence, price action trading relies on the belief that historical price movements are the best indicators of future performance, allowing traders to make decisions based on price itself rather than external indicators.