


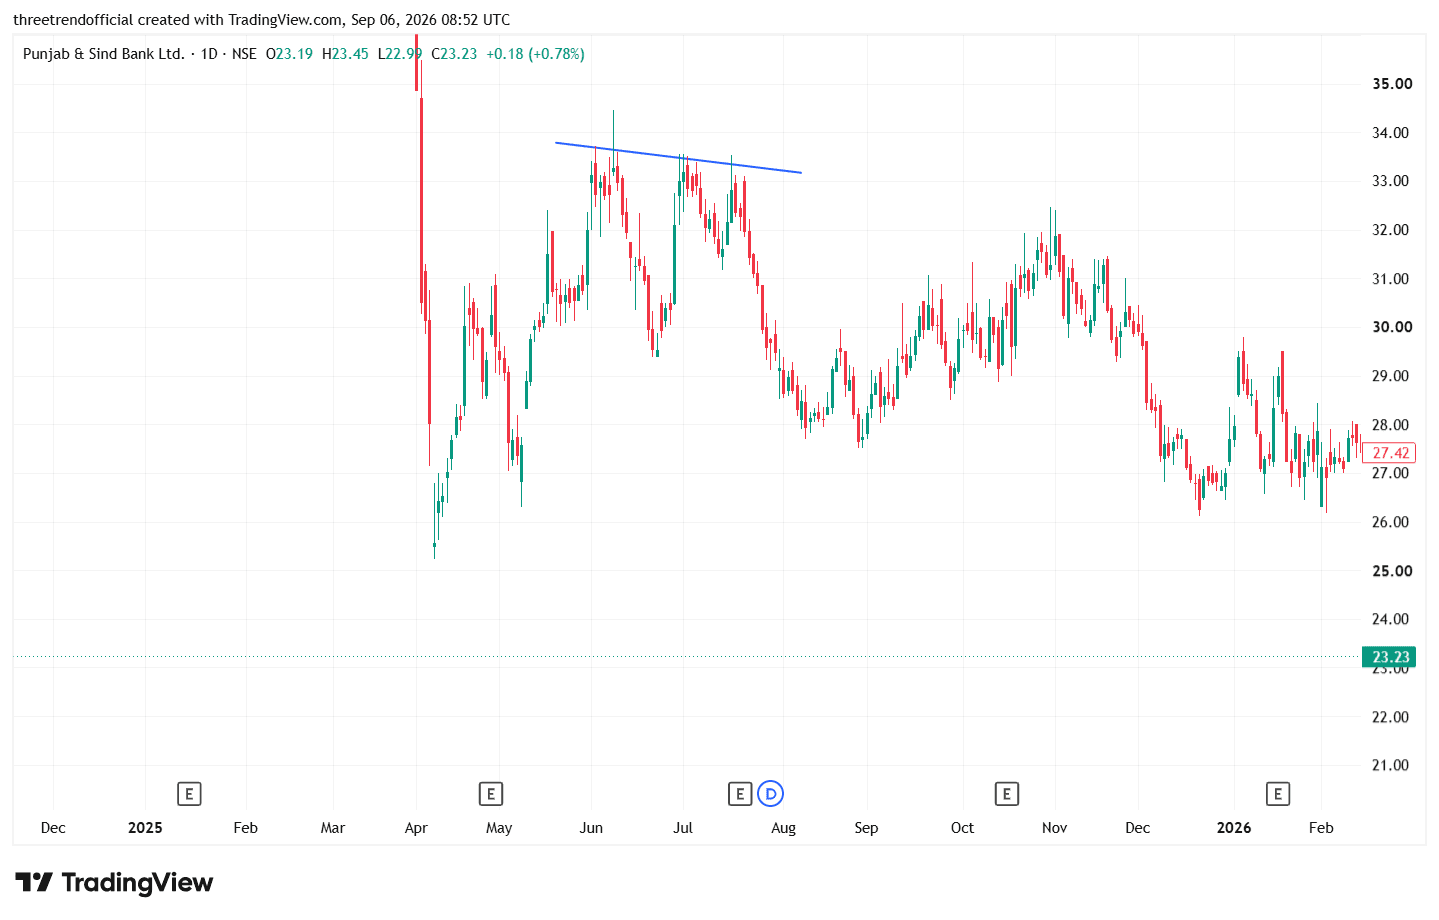
A trendline acts as resistance chart example
PSB A trendline acts as resistance when it connects a series of lower swing highs in a downtrend. As the price approaches this descending trendline, sellers often become active and push the price lower. Repeated rejection from the trendline makes it a strong dynamic resistance zone. A bearish rejection can indicate that sellers are still in control, while a decisive breakout above the trendline can signal weakening selling pressure and a possible trend reversal. Higher volume during the breakout provides stronger confirmation.
In simple terms:
Lower highs → descending trendline → repeated rejection → resistance → breakout above trendline = possible bullish reversal.
chart is attached for reference
#TechnicalViews#FundamentalViews
430 likes·86 comments