


Bajaj Finance
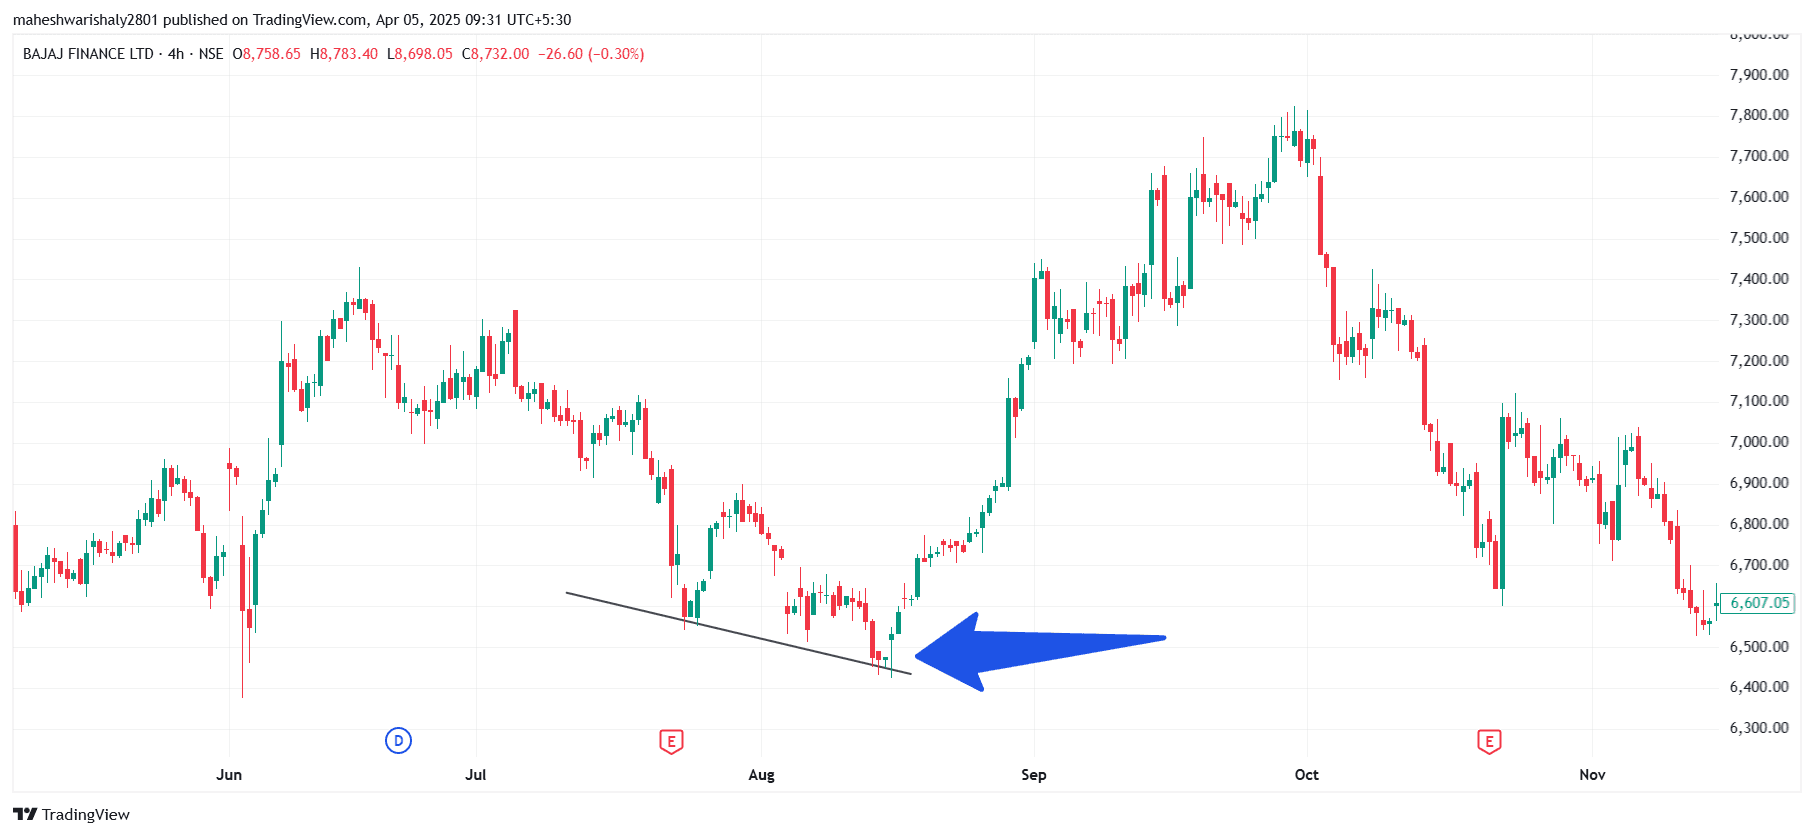
BAJFINANCE The bullish hammer pattern is a candlestick formation that signals a potential reversal from a downtrend to an uptrend. It typically has a small real body near the upper end of the trading range and a long lower shadow, indicating that sellers tried to push the price down but buyers regained control before the close.
When this pattern occurs at a trendline support zone, its significance increases because the support zone adds an extra layer of confirmation.
Stock chart is an example of bullish hammer pattern with the trendline support zone.
#StockInNews#Today’sTradingSetup#TechnicalViews#FundamentalViews#Miscellaneous
1 like