


DMART
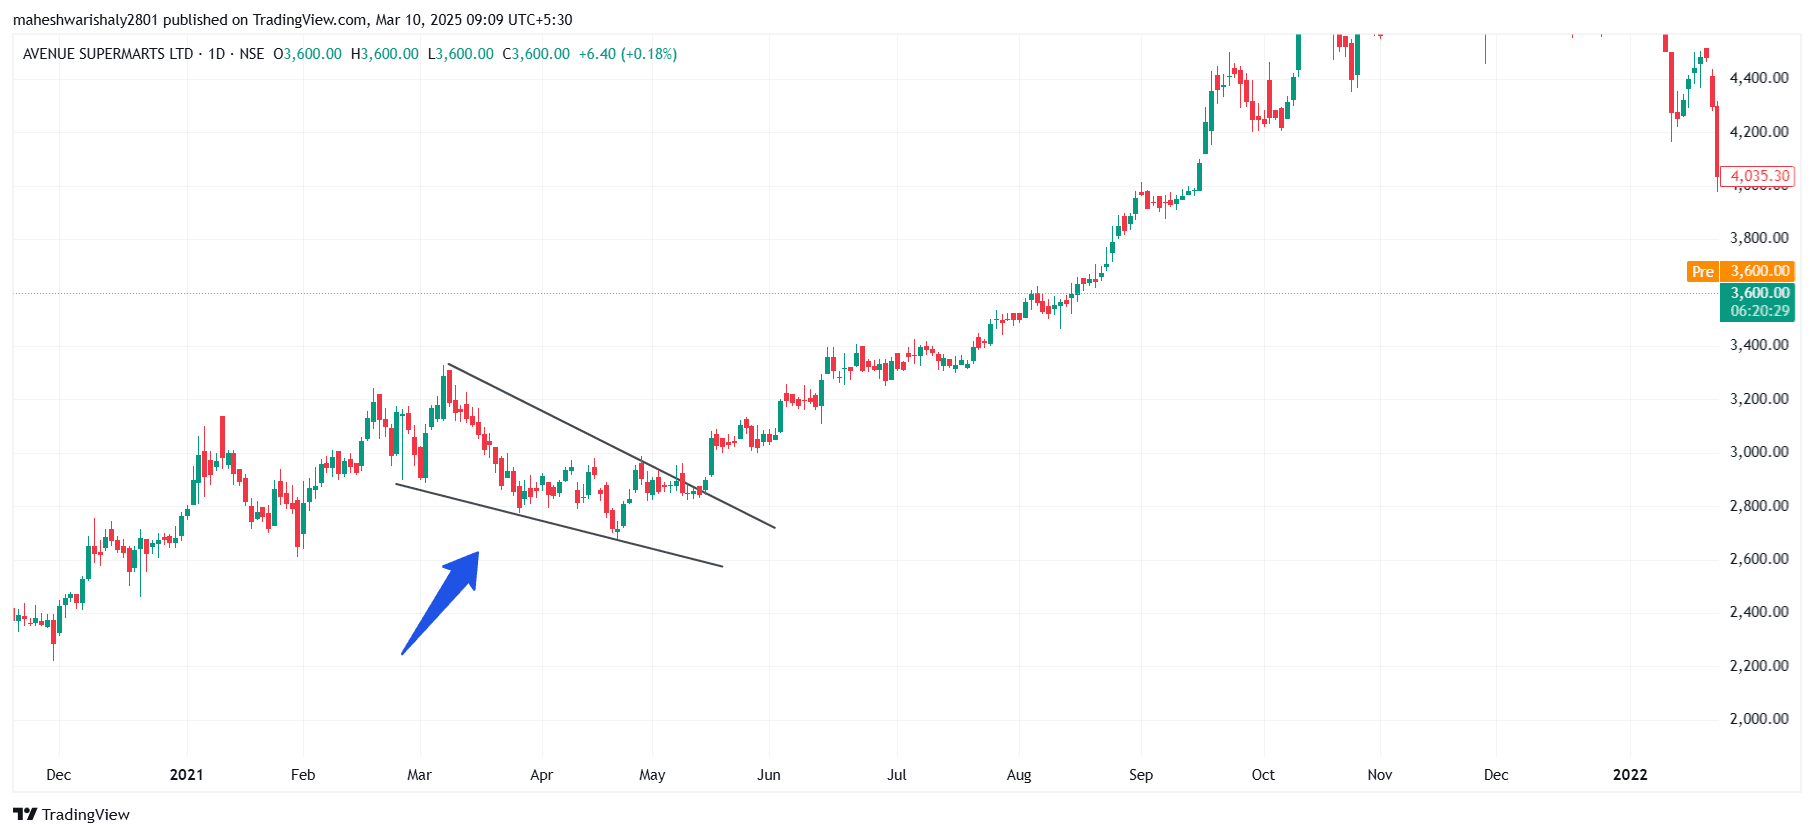
DMART This is how traingle works in the stock ***** Triangle Candlestick Pattern is a technical chart pattern that appears when price movements form a triangular shape on a candlestick chart, indicating a period of consolidation before a breakout (price movement in one direction). It can signal a potential continuation or reversal in the market, depending on the breakout direction.
#Today’sTradingSetup#StockInNews#TechnicalViews#EquityResearch
198 likes·40 comments