


Himadri Specialty Chemical – Technical Analysis
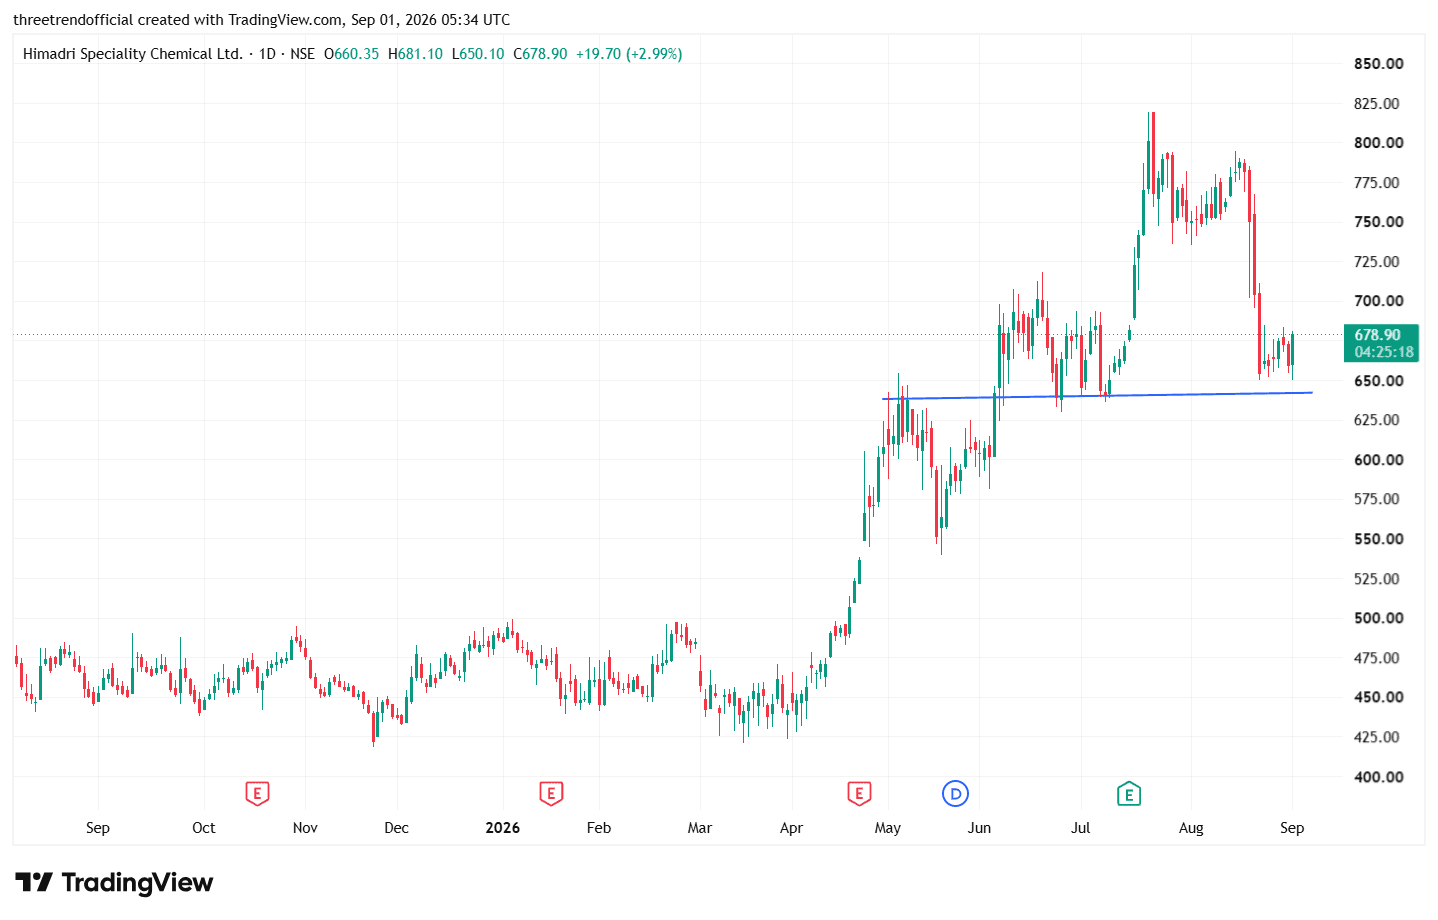
HSCL The chart shows a strong breakout above the long-term trendline around ₹640–₹650, followed by a sharp rally toward ₹800. After the rally, the stock witnessed profit booking and has now returned close to the ₹650–₹660 support zone. This area is important because the previous breakout level can potentially act as new support. If the stock holds ₹650 and forms a bullish reversal, it could indicate that the breakout is being successfully retested, with ₹700 and ₹750 as potential recovery levels. However, a decisive breakdown below ₹640–₹650 would weaken the breakout structure and could lead to further correction. chart is attached forstudy purpose so that you can relate ***** through chart
#TechnicalViews
1,058 likes·89 comments