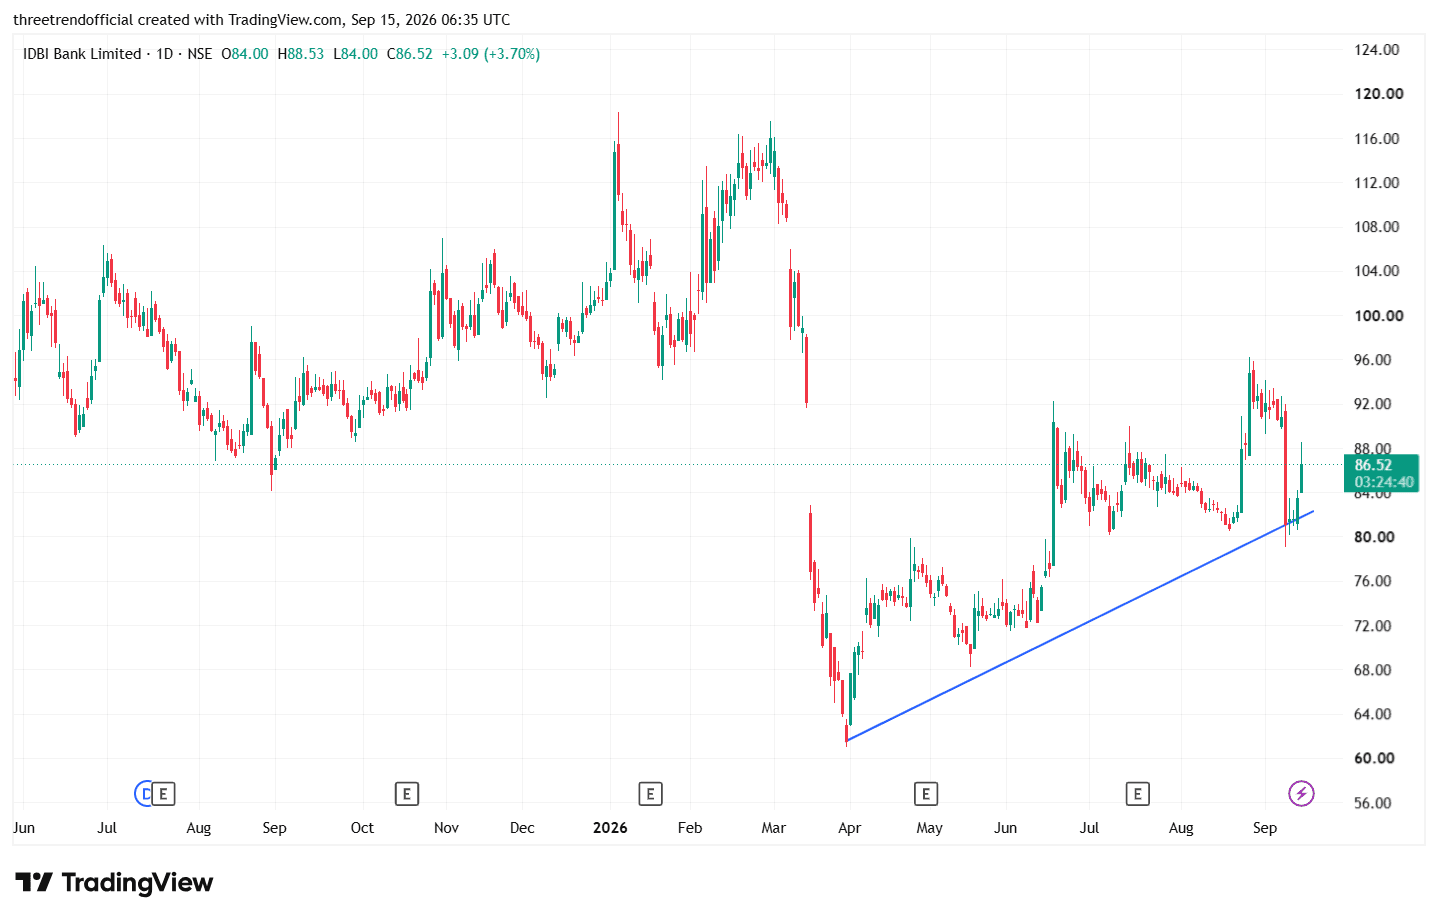
Importance of a Bullish Candlestick Pattern at Trendline
IDBI
Importance of a Bullish Candlestick Pattern at Trendline Support
When a bullish candlestick pattern forms exactly near a well-established trendline support zone, it creates a strong technical confluence. The trendline indicates that buyers have previously defended that price area, while the bullish candle provides price-action confirmation that selling pressure may be weakening and buyers are returning.
Common bullish patterns to watch:
🟢 Bullish Engulfing — strong shift from sellers to buyers.
🟢 Hammer — rejection of lower prices and buying near support.
🟢 Morning Star — potential reversal after a decline.
🟢 Bullish Marubozu — strong buying pressure during the session.
Why the combination is important
Trendline Support + Bullish Candle + Volume = Stronger Confirmation
For example:
Price falls → reaches trendline support → forms Hammer/Bullish Engulfing → volume increases → next candle closes above the pattern high
This provides multiple confirmations rather than relying on the candlestick alone. Higher volume and follow-through can make the signal more convincing.
Simple market interpretation
“A bullish candlestick at trendline support suggests that sellers are losing control at an important demand zone and buyers are attempting to defend the support.”
However, it is not a guaranteed reversal signal. Ideally, wait for confirmation through the next candle, volume and a close above the bullish pattern's high.
In short: A bullish candle at a random location is less meaningful; a bullish candle forming at a repeatedly tested trendline support zone carries much more technical significance because both price structure and price action are pointing in the same direction.