


IOC
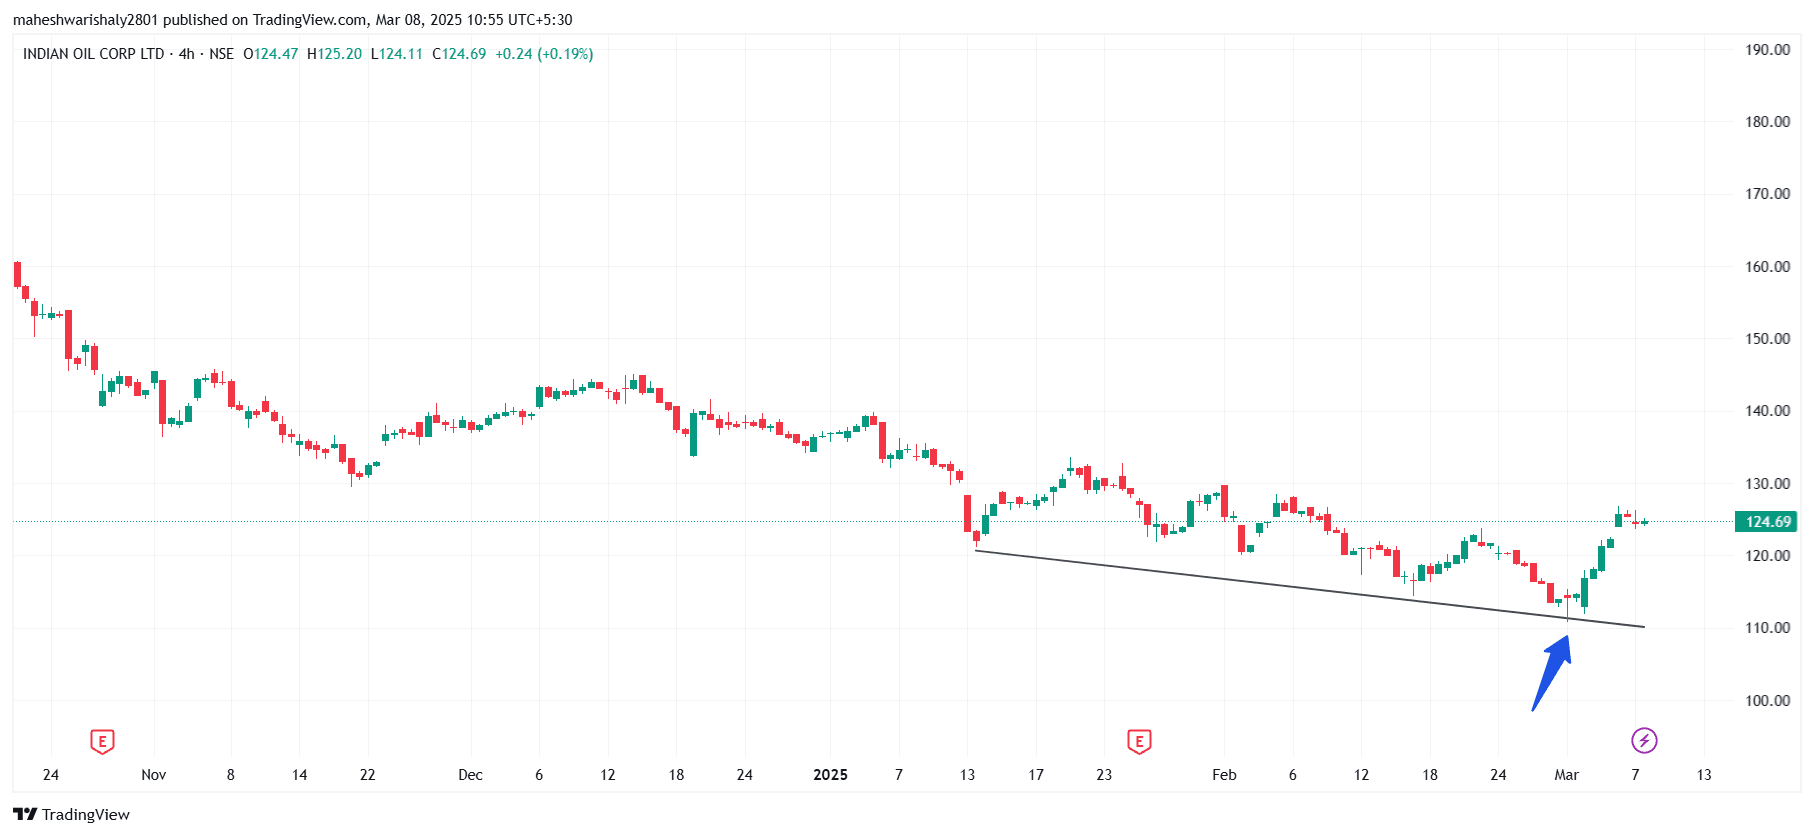
IOC This is how candlestick pattern works, stock chart is perfect example of Bullish doji candlestick pattern at the bottom of the rally and after that upside in the stock, chart is attached for your reference.
#Today’sTradingSetup#StockInNews#WatchOutFor#TechnicalViews#EquityResearch
293 likes·63 comments