


ITC
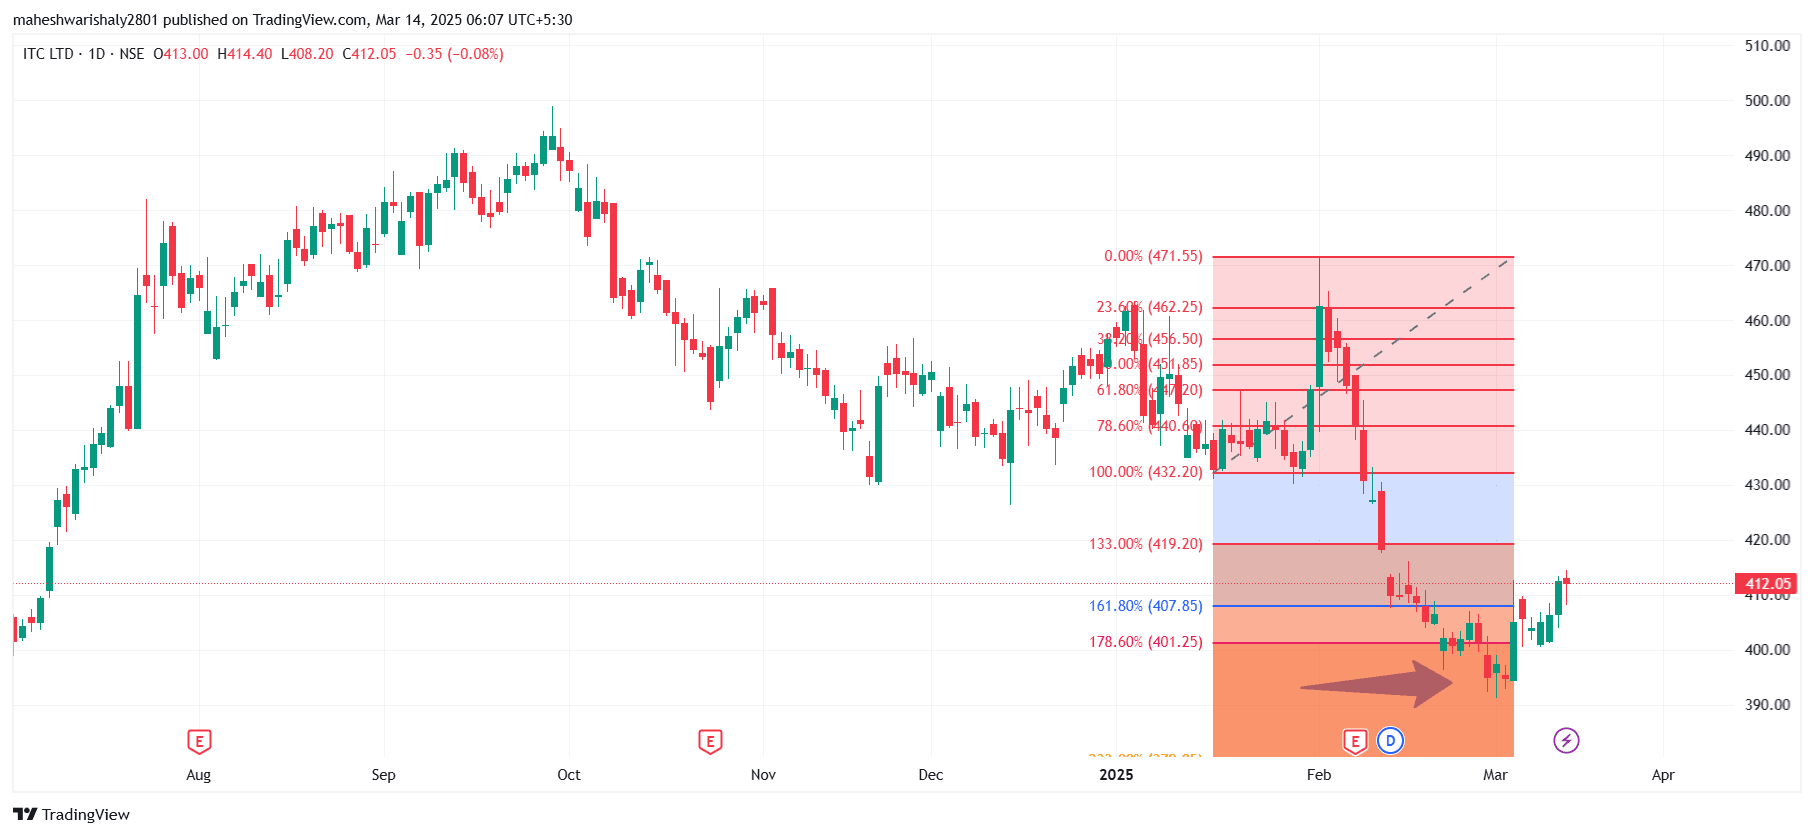
ITC Itc Chart is example of bullish hammer formation near 1.618-1.786 fibo zone. The bullish hammer is a candlestick pattern that typically appears at the bottom of a downtrend and signals a potential reversal to the upside.
#StockInNews#Today’sTradingSetup#TechnicalViews#FundamentalViews#EquityResearch
179 likes·45 comments