Nestle Ind
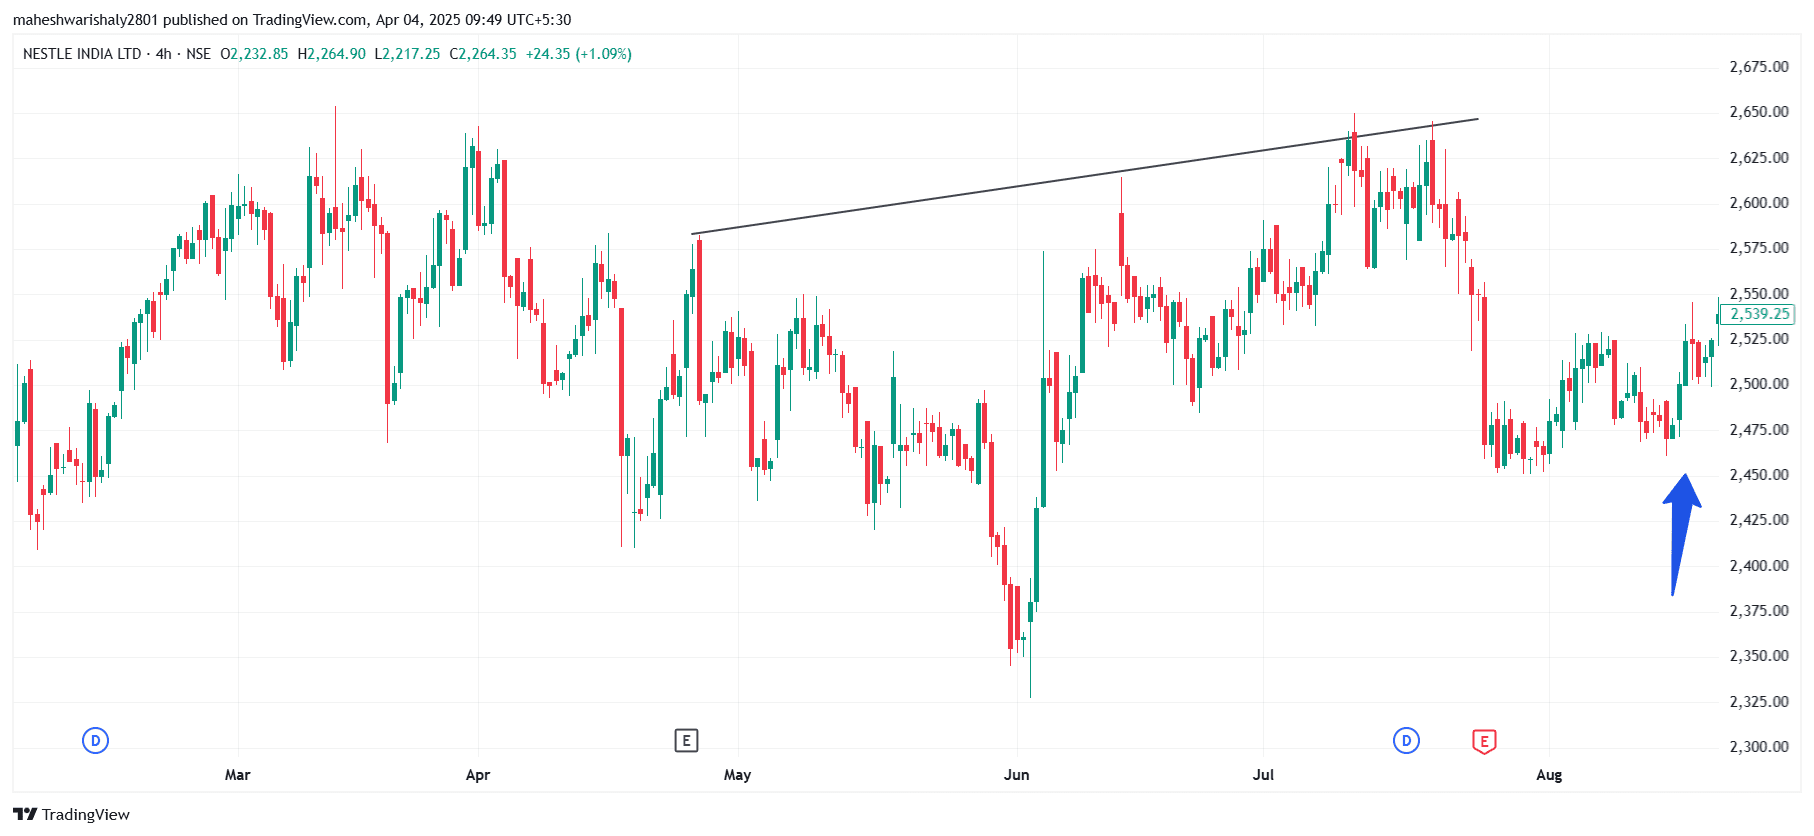
NESTLEIND A trendline resistance line is a diagonal line drawn on a price chart to indicate a level where the price has repeatedly struggled to rise above. It connects the highs of the price movements and acts as a barrier, suggesting that selling pressure is strong at that level. This concept is commonly used in technical analysis for stocks, forex, cryptocurrencies, and other financial markets.
A stock chart is an example of trendline resistance line concept.
#WatchOutFor#StockInNews#FundamentalViews#TechnicalViews#EquityResearch