


NTPC
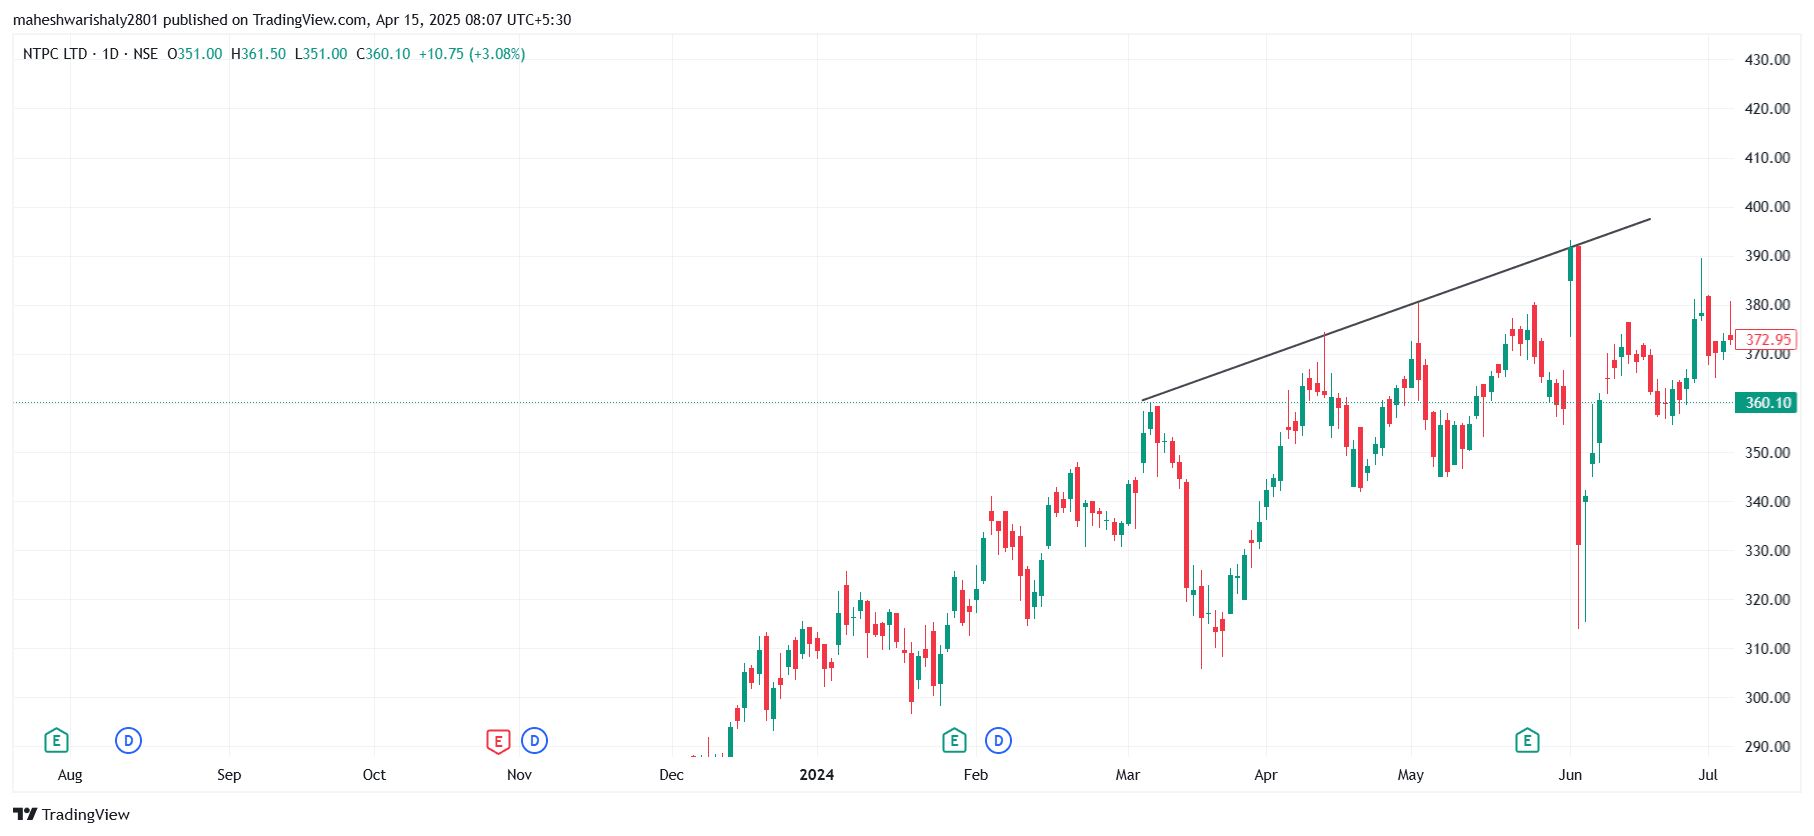
NTPC ntpc Stock chart is attached that shows trendline works as a resistance zone.
A resistance trendline is a downward-sloping line that connects multiple swing highs on a price chart. When price touches this trendline multiple times but fails to break above it, it confirms the trendline as a strong resistance level.
#WatchOutFor#Today’sTradingSetup#StockInNews#FundamentalViews#TechnicalViews
139 likes·84 comments