


ongc
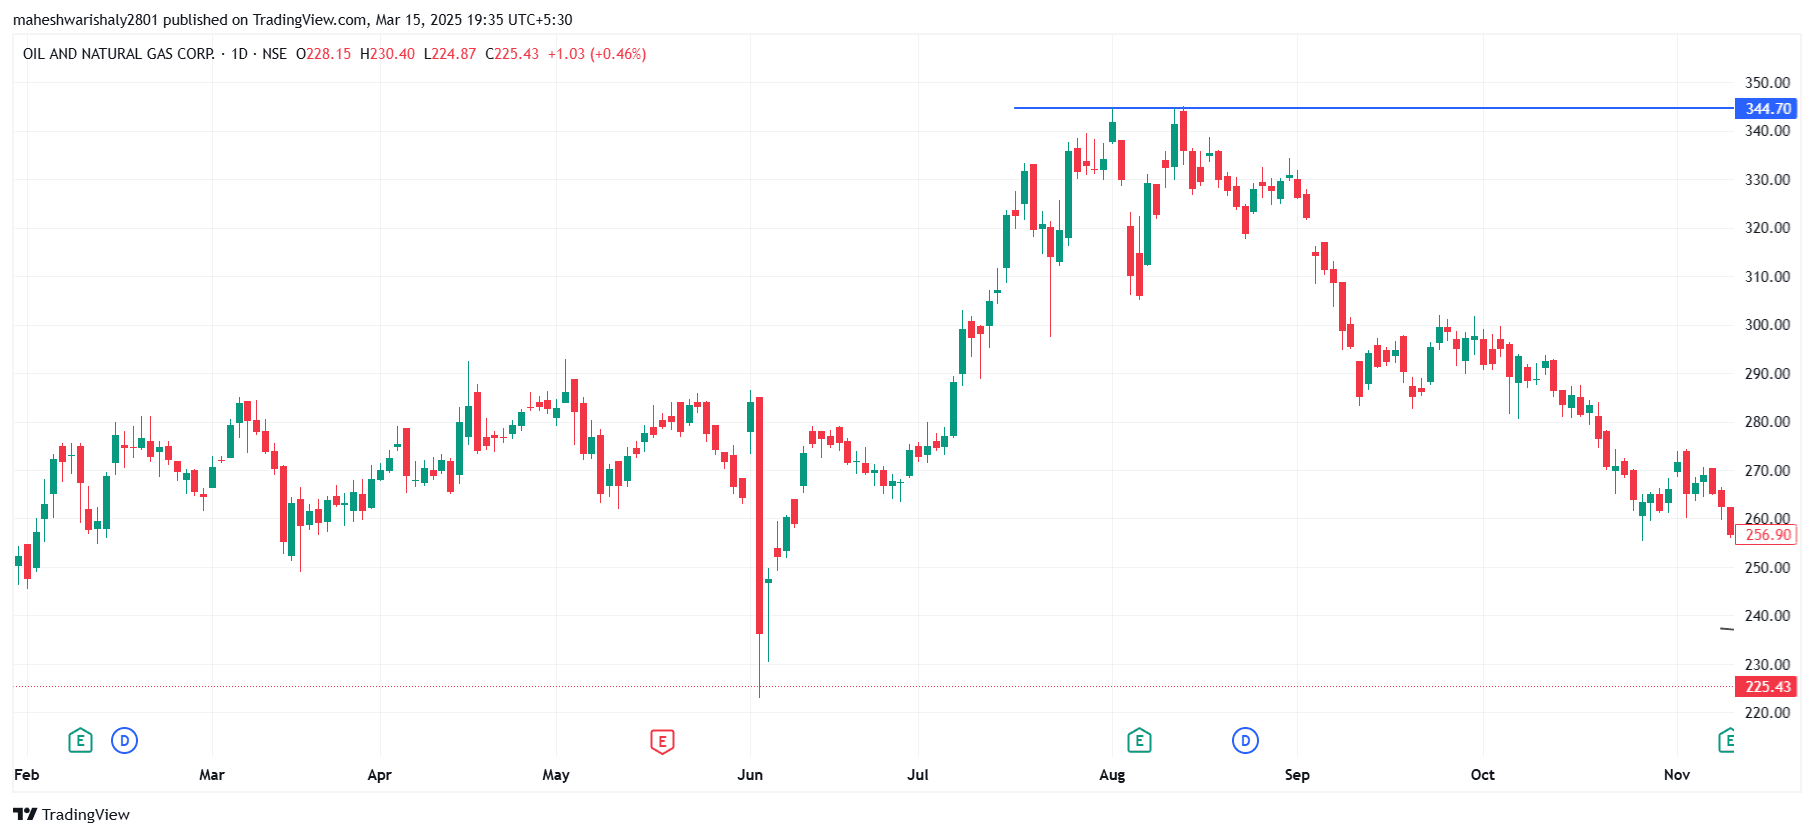
ONGC Stock chart is example of how double top pattern works in stock market.A Double Top is a bearish reversal chart pattern that typically signals a potential trend reversal from an uptrend to a downtrend. It forms after an uptrend and is characterized by two peaks or highs at roughly the same price level, followed by a drop in price and a subsequent failure to rise above the previous highs. This pattern is often seen as an indication that the buying pressure is fading and the market could be ready for a downward move.
#Today’sTradingSetup#StockInNews#WatchOutFor#FundamentalViews#TechnicalViews
160 likes·81 comments