PNB
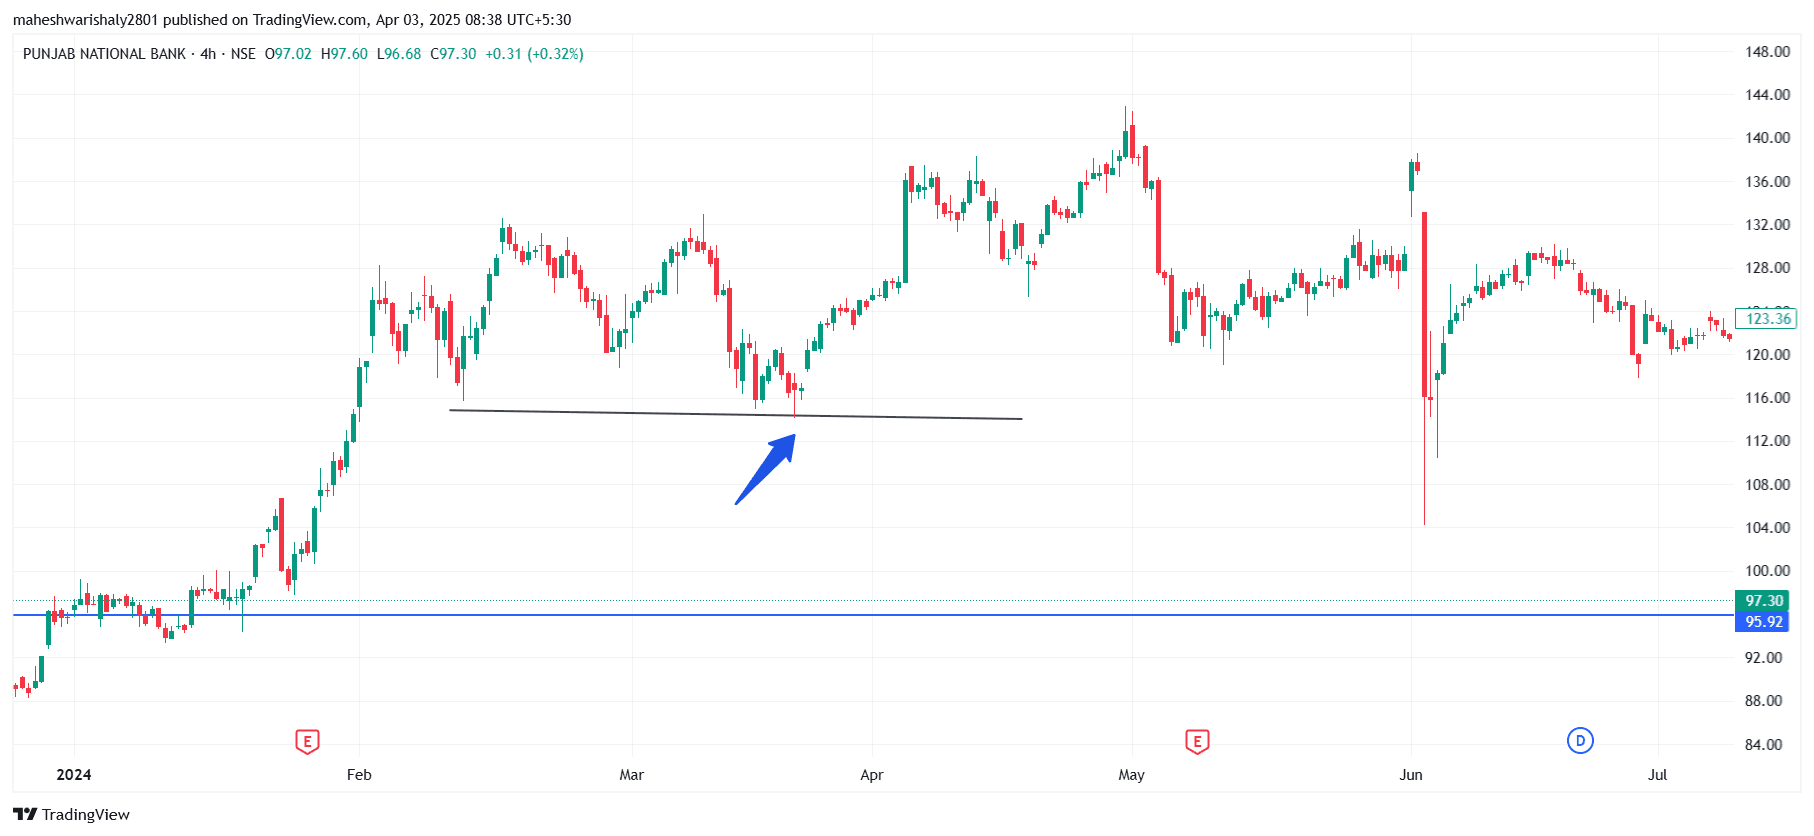
PNB Stock chart is an example of Bullish hammer candlestick pattern with trend support line
The Bullish Hammer Candlestick Pattern is a powerful reversal signal that suggests a potential change from a downtrend to an uptrend. It's characterized by a small real body at the upper end of the trading range and a long lower shadow, resembling a hammer. This pattern often forms near a support line, which strengthens the signal.
#StockInNews#Today’sTradingSetup#FundamentalViews#TechnicalViews#EquityResearch