


STATE BANK OF INDIA TECHNICAL CHARTS FOR LEARNING PURPOSE
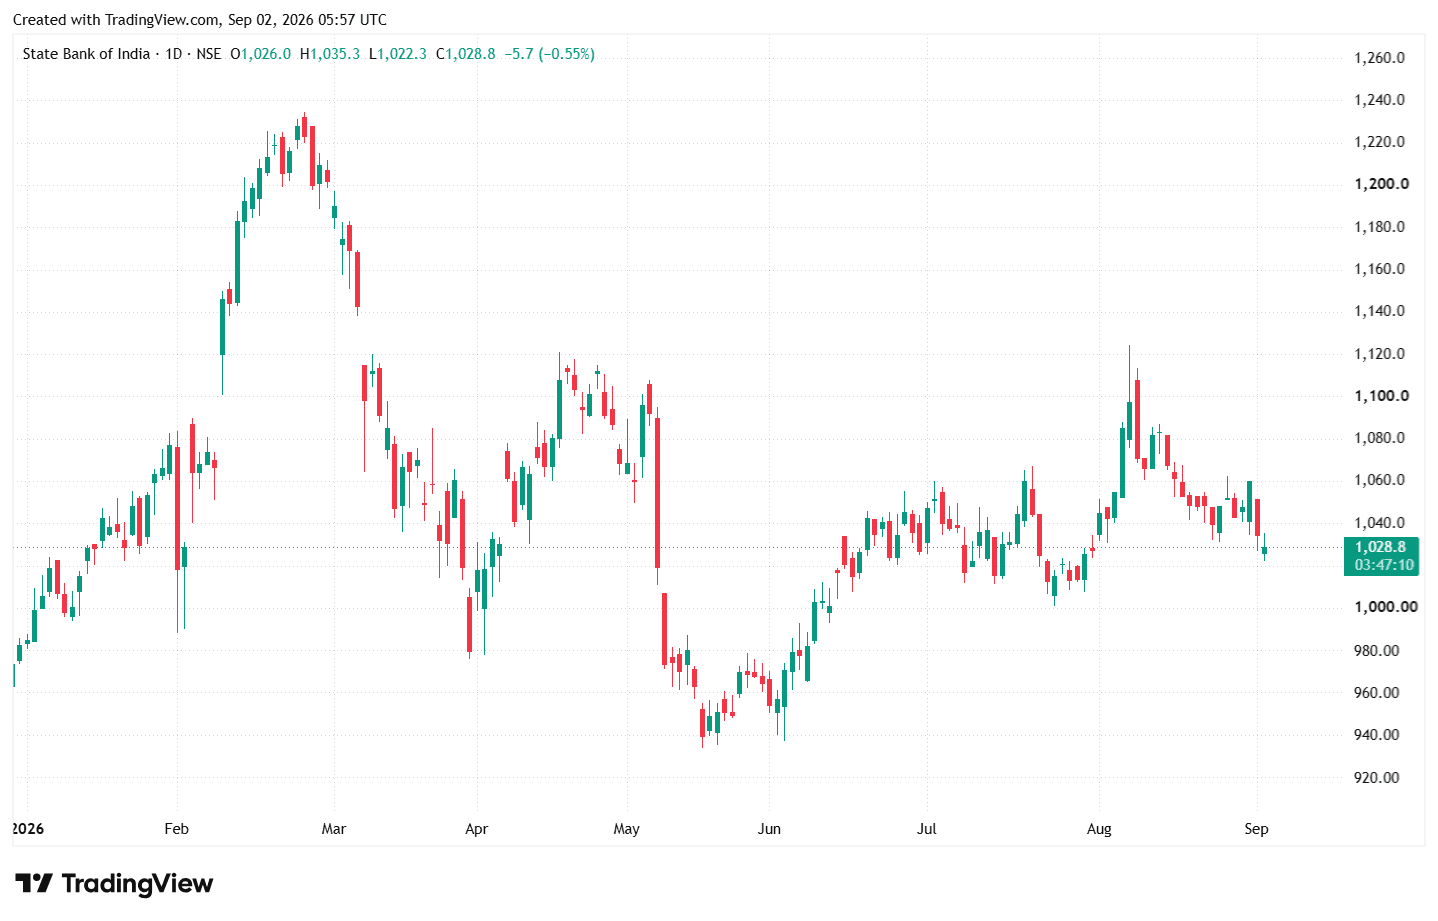
SBIN The chart shows SBI currently trading around ₹1,029, after facing selling pressure from the recent ₹1,080–₹1,100 swing-high zone. The stock has formed a series of short-term higher lows since June, but the recent decline indicates some profit booking. The ₹1,020–₹1,000 zone is an important immediate support area, as buyers have previously emerged around these levels. If SBI holds this zone and forms a bullish reversal, it could attempt a recovery toward ₹1,050–₹1,080. A sustained move above ₹1,080 would strengthen the bullish structure and potentially open the way toward ₹1,100+. However, a decisive breakdown below ₹1,000 would weaken the current structure and increase downside risk.
#StockInNews
600 likes·57 comments