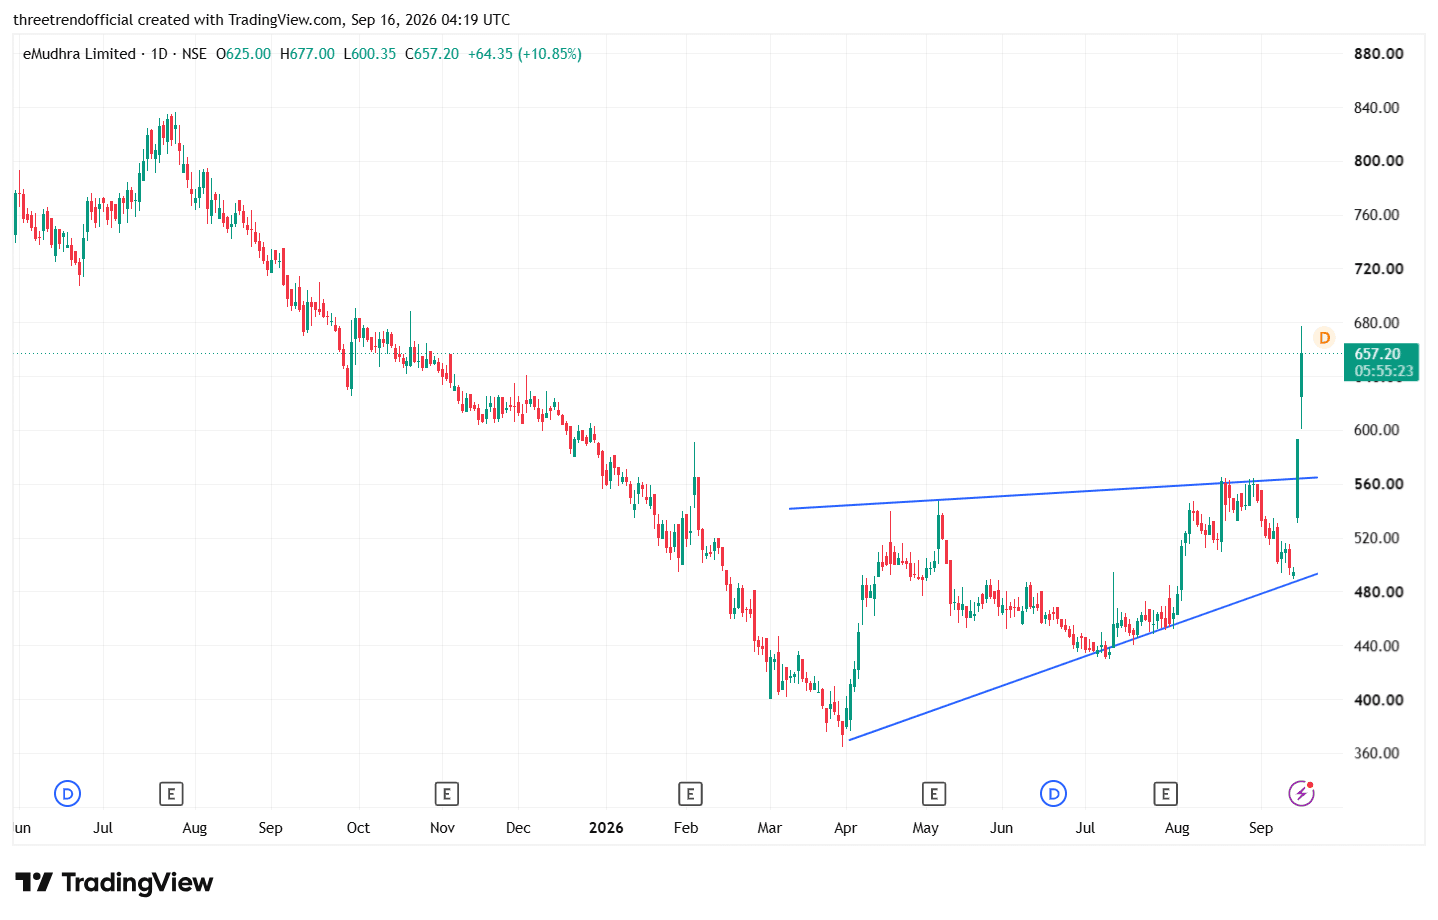
The chart shows a bullish ascending-triangle breakout
EMUDHRA
eMudhra — Triangle Breakout
The chart shows a bullish ascending-triangle breakout. Price was forming higher lows along the rising lower trendline, while the ₹550–₹565 zone acted as the upper resistance. The sharp move above this resistance indicates a breakout from the triangle, accompanied by strong price momentum.
Breakout zone: ₹550–₹565
Immediate support after breakout: ₹560–₹580
Next support: ₹520–₹540
Immediate resistance: ₹675–₹680
Higher resistance: ₹710–₹720, near the previous major high
The breakout is significant because price has moved decisively above the triangle's upper boundary. The stock closed at ₹592.85 on September 15 after gaining 20%, with substantially higher trading activity than recent sessions.
In simple terms: eMudhra has broken out of a multi-month ascending triangle after forming higher lows, indicating a major expansion in price momentum. The ₹550–₹565 breakout zone can now become an important support area; a successful retest and bullish price action around this zone would provide further confirmation of the breakout.