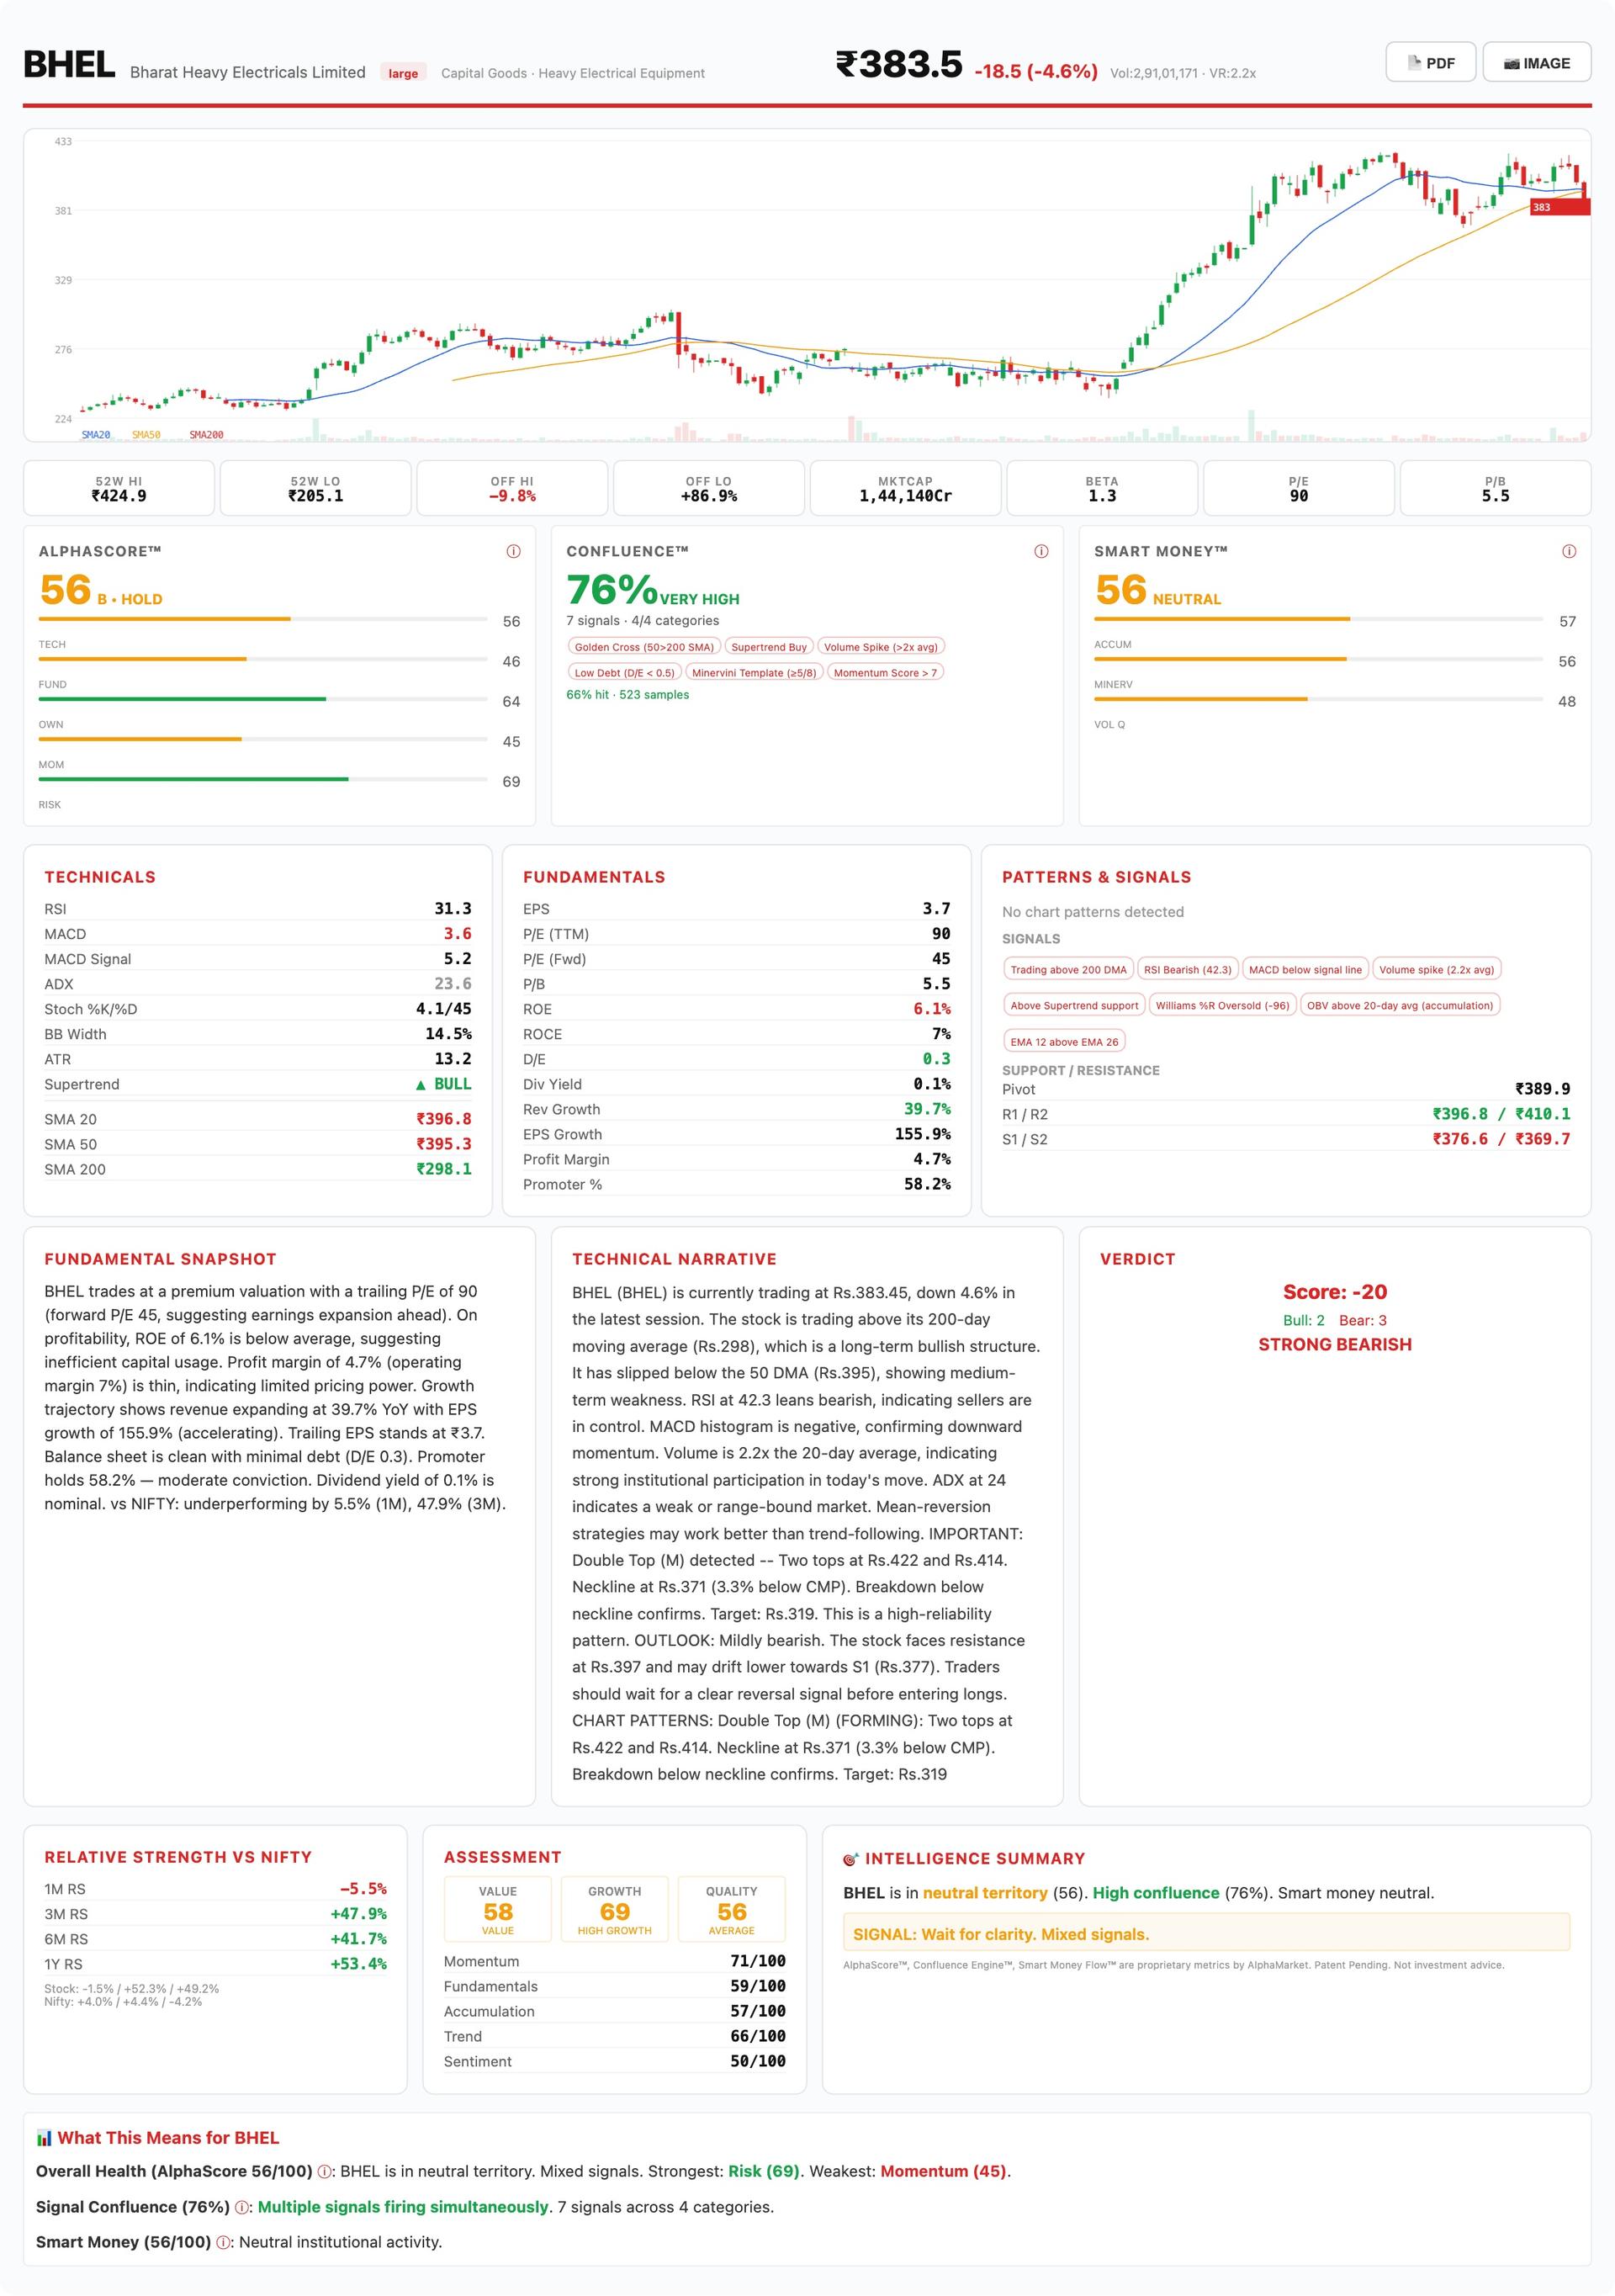
is currently trading at Rs.383.45, down 4.6% in the latest session. The stock is trading above its 200-day moving average (Rs.298), which is a long-term bullish structure. It has slipped below the 50 DMA (Rs.395), showing medium-term weakness. RSI at 42.3 leans bearish, indicating sellers are in control. MACD histogram is negative, confirming downward momentum. Volume is 2.2x the 20-day average, indicating strong institutional participation in today's move. ADX at 24 indicates a weak or range-bound market. Mean-reversion strategies may work better than trend-following. IMPORTANT: Double Top (M) detected -- Two tops at Rs.422 and Rs.414. Neckline at Rs.371 (3.3% below CMP). Breakdown below neckline confirms. Target: Rs.319. This is a high-reliability pattern. OUTLOOK: Mildly bearish. The stock faces resistance at Rs.397 and may drift lower towards S1 (Rs.377). Traders should wait for a clear reversal signal before entering longs. CHART PATTERNS: Double Top (M) (FORMING): Two tops at Rs.422 and Rs.414. Neckline at Rs.371 (3.3% below CMP). Breakdown below neckline confirms.