30th Apr 2025 · SEBI-Registered Analyst
STOCKYARD with Mohammed Adil · 30th Apr 2025
"Mastering RSI: The Trader’s Guide to Momentum and Reversals"
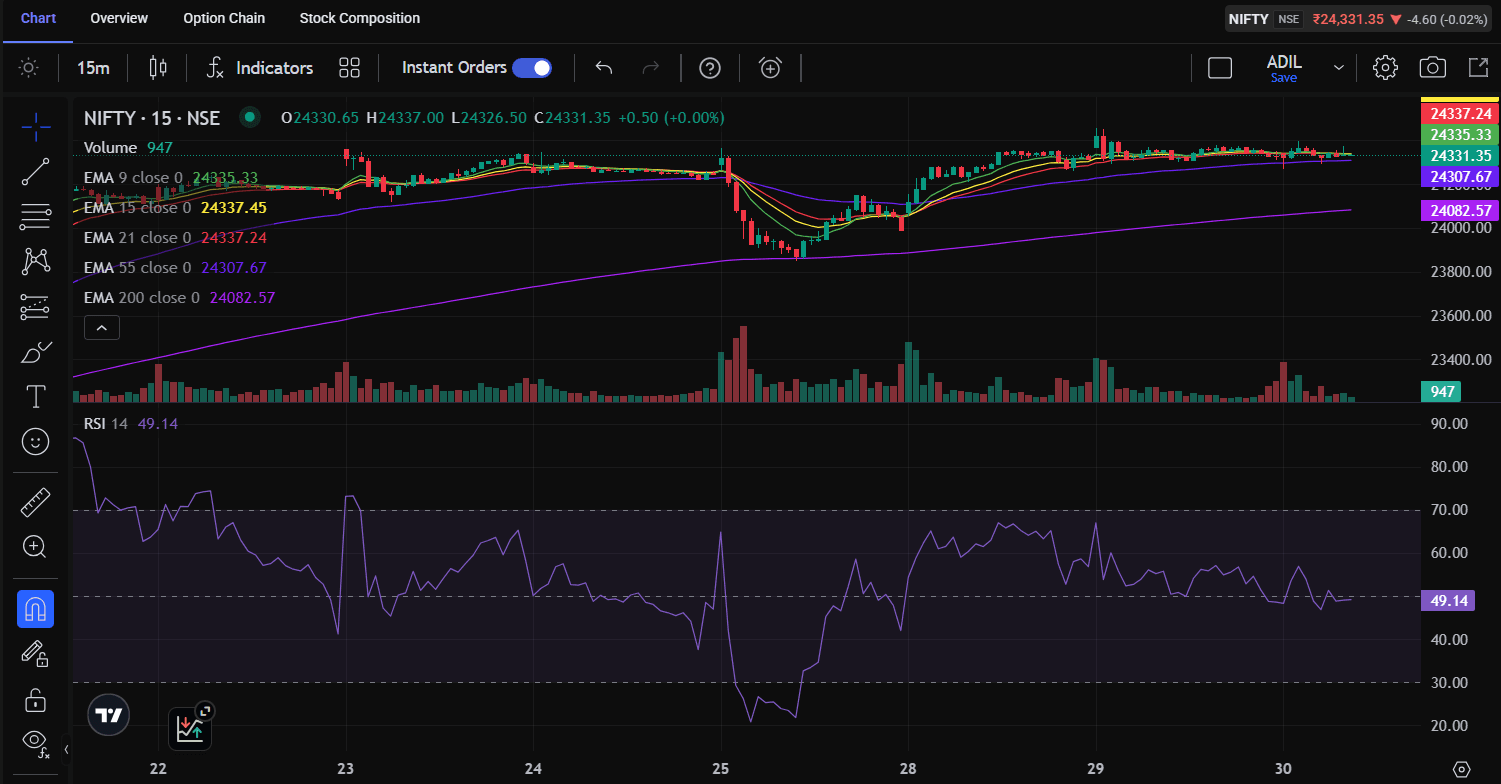
📊 RSI (Relative Strength Index) is a momentum oscillator that measures the speed and change of price movements. It helps traders identify overbought or oversold conditions in a stock or index. The default setting is 14 periods (candles) — it can be 14 days, hours, etc., depending on the chart timeframe. 📏 RSI Scale RSI is plotted on a scale of 0 to 100. RSI Value Interpretation Above 70 Overbought (possible reversal or correction) Below 30 Oversold (possible bounce or rally) Around 50 Neutral (no clear trend) 🧠 How Traders Use RSI Overbought/Oversold Zones RSI > 70: Watch for potential short or profit booking opportunities. RSI < 30: Watch for buying or reversal setups. Divergences Bullish Divergence: Price makes a lower low, RSI makes a higher low → possible uptrend. Bearish Divergence: Price makes a higher high, RSI makes a lower high → possible downtrend. RSI with Trend In strong uptrends, RSI may stay above 70 for long — don't sell blindly. In strong downtrends, RSI may remain below 30 — don’t buy early. 📉 Example: A stock moves from ₹100 to ₹120 over 10 candles → RSI goes above 70. Then it pulls back to ₹115 → RSI drops to 60. If price goes up again to ₹125 but RSI goes only to 65 → bearish divergence. #stockmarket #investing #trading #stocks #investment #finance #money #nifty #forex #sharemarket #investor #invest #financialfreedom #trader #business #stockmarketindia #daytrader #stock #stockmarketnews #nse #entrepreneur #bse #sensex #daytrading #wealth #forextrading