



Axis Bank - Technical learning
AXISBANK
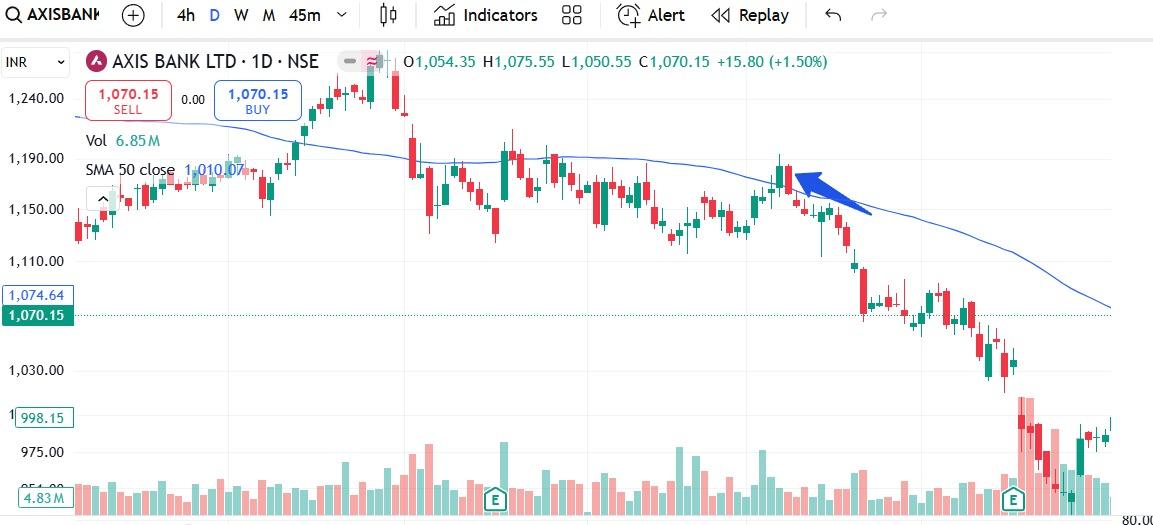
1) This is daily chart for Axis Bank.
2) This is old data for learning.
3) Older than 3 months.
4) We can see the Bearish Engulfing candle.
5) A bearish engulfing is the candle in which the body of earlier green candle in completely engulfed by red candle.
6) This generally indicates the change of trend. We can see that after this candle the trend completely changed, and stock prices fell from there.
7) This is not a buy/sell call
Thank you,
Technofunda24
#StockInNews#TechnicalViews
115 likes·51 comments