



Bank Nifty - negative divergence on charts
Bank Nifty - negative divergence on charts
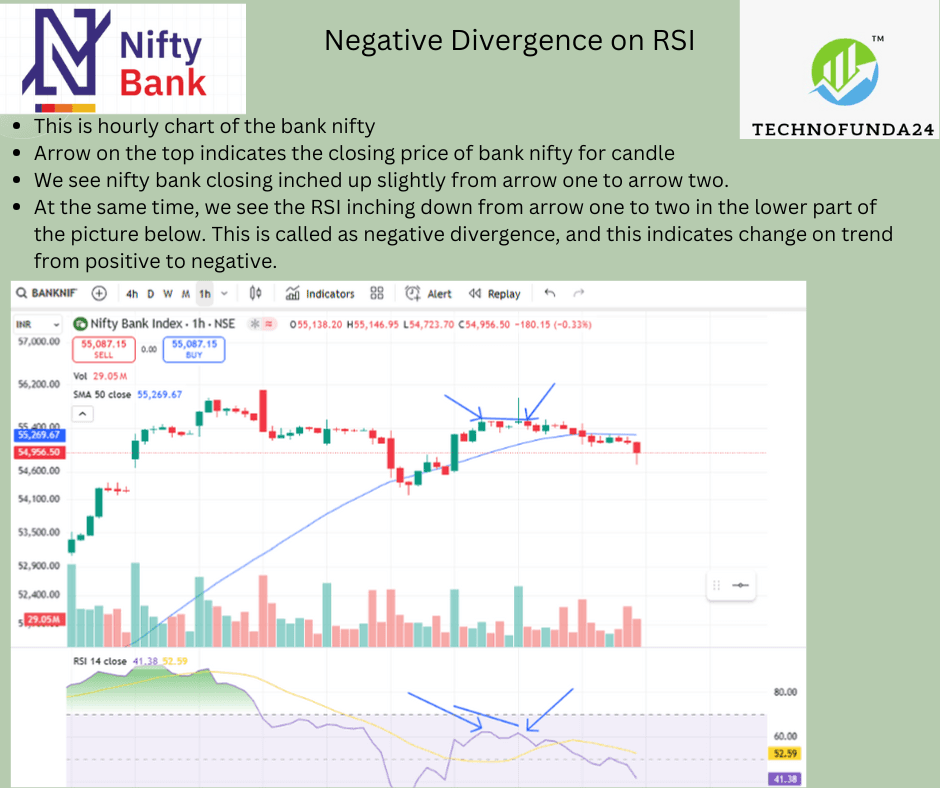
1) Chart attached in media
2) This is hourly chart
3) Arrow on the top indicates the closing price of bank nifty for candle
4) We see nifty bank closing inched up slightly from arrow one to arrow two.
5) At the same time, we see the RSI inching down from arrow one to two in the lower part of the picture below. This is called as negative divergence, and this indicates change on trend from positive to negative.
6) This learning helps us to understand the trend change.
7) This is on hourly candle hence this indicates trend reversal for 2-5 days only.
8) Stock on radar - ICICIBANK
9) This is all for information. This is not a buy/sell call.
Thank you,
Technofunda24
#WatchOutFor#TechnicalViews
183 likes·66 comments