



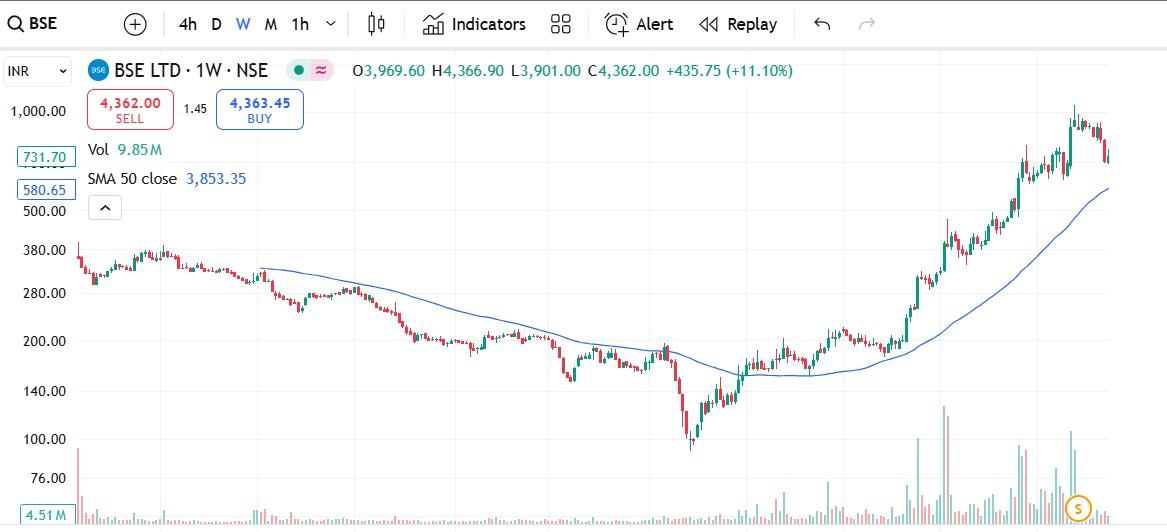
BSE - Power of SMA 50 on weekly chart
BSE
1) Chart attached in media
2) This is weekly chart
3) Blue line represents SMA 50
4) This is simple moving average for 50 candles
5) SMA 50 is respected even in bad times on weekly chart
6) Stock bounces back from these levels
7) We can clearly see that earlier it was resistance and once crossed it becomes support in bad times as well.
8) This is for information and learning.
9) This is not a buy/sell call
Thank you,
Technofunda24
#WatchOutFor#TechnicalViews
154 likes