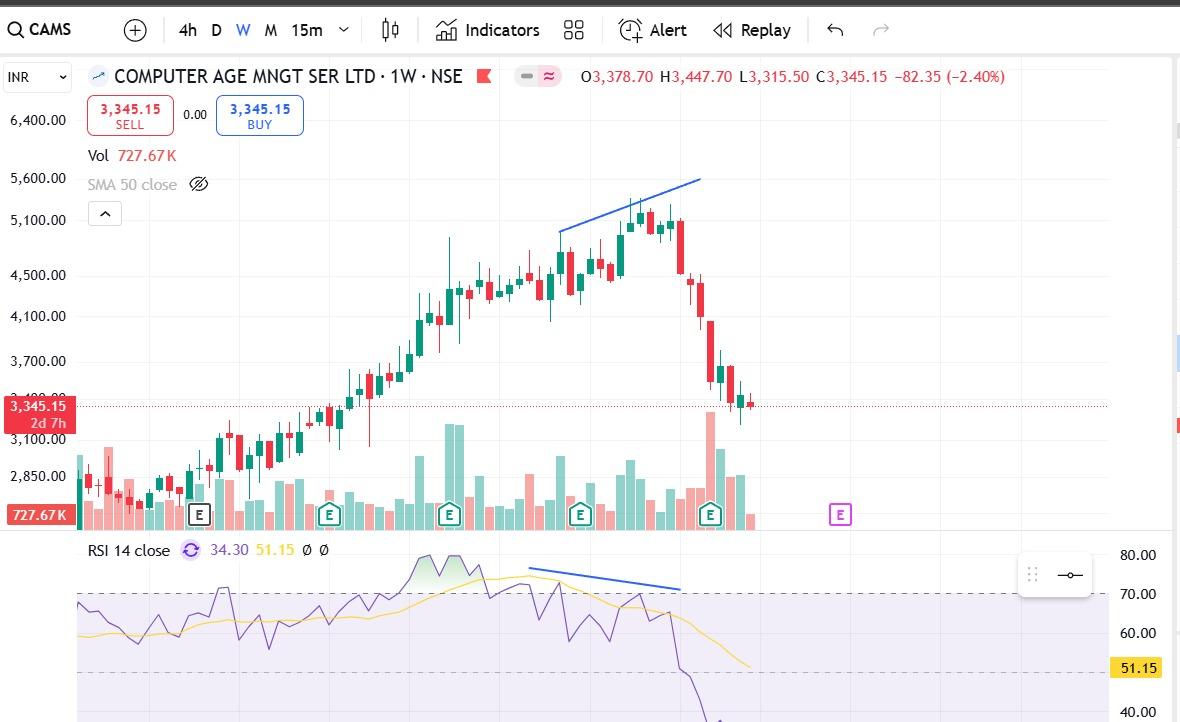
CAMS - Learning for RSI negative divergence
CAMS - Learning for RSI negative divergence
1) CAMS
2) Chart attached in media
3) This is negative divergence
4) Upper part of chart shows prices of the stock on weekly closing
5) Lower side of chart shows RSI movement for the same period.
6) Prices are moving higher in the upper part of chart as indicated by blue line
7) Whereas, RSI is moving down. This is called as negative divergence as prices are moving high and RSI going down.
8) This is followed by the fall in the stock.
9) This is for leaning. This is not a buy/sell call.
Thank you,
Technofunda24
#WatchOutFor#TechnicalViews