



Chart learning for M&M Financial
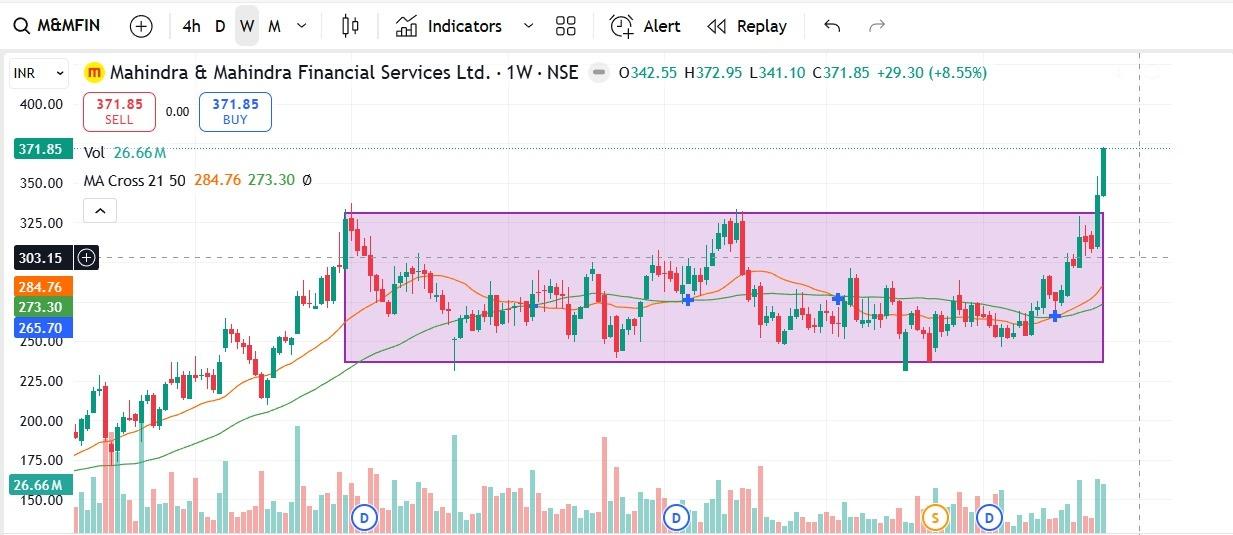
Chart learning for M&M Financial - M&MFIN
1) Chart update
2) after the breakout
3) all this is past data
4) after the breakout stock rose almost 12% in 10 days
5) Chart indicated all positive signs - like price action, volume action, RSI above 60, Sector bias positive, Nifty bias positive, Breakout seen on charts & all RSI above 60(daily, weekly and monthly)
6) All this is for reference and learning.
7) This is not a buy/sell recommendation.
if you want to learn study at least 15-20 charts per day for better understanding.
Thank you,
Technofunda24
#TechnicalViews#StockInNews
979 likes·72 comments