



Dmart - Learning of Technical Retracement
DMART
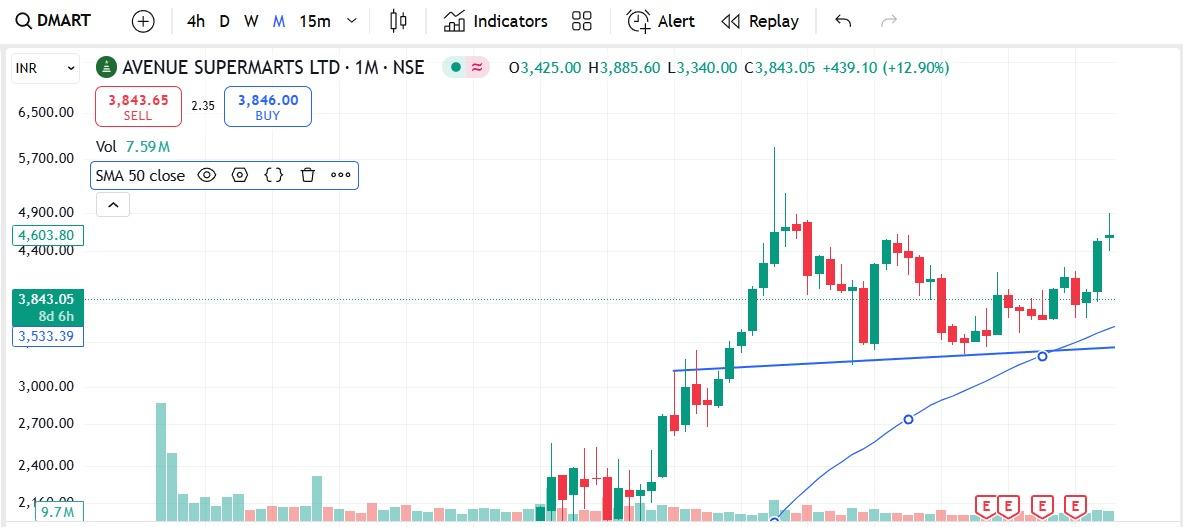
1) Chart attached in media
2) This is monthly chart
3) This is older data
4) This data is older than 3 months
5) Technical trendline is drawn on charts
6) Earlier resistance on charts now becomes the support for the stock
7) This is clearly seen on charts. Probability of success when you buy at trendline support becomes high on long term charts.
8) This is for information and learning.
9) This is not a buy/sell call
Thank you,
Technofunda24
#WatchOutFor#TechnicalViews
197 likes·38 comments