



FSL - Technical view
FSL
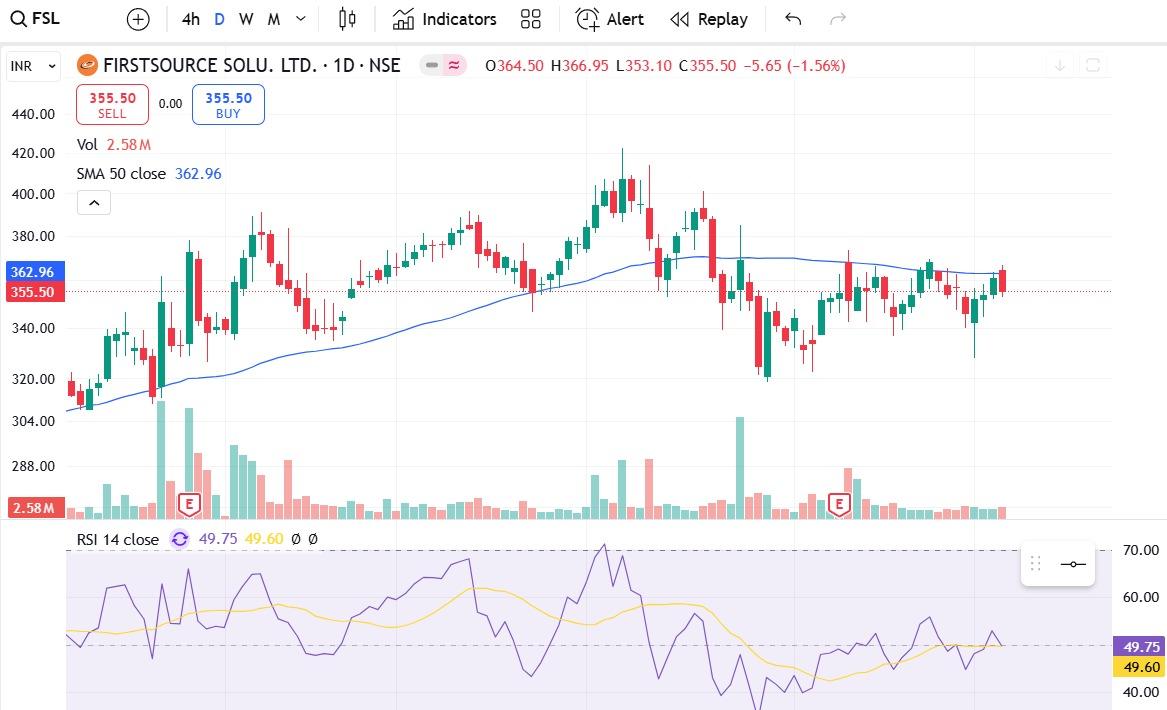
1) Chart attached in media
2) This is daily chart
3) Stock facing resistance at 50 SMA
4) Earlier 50 SMA was working as support
5) This is from IT sector
6) Nifty bias is now positive
7) Nifty may help the stock to get pass 50 SMA
8) As of now trend is sideways as RSI is below 60
9) This is for information and learning. This is not a buy/sell call.
Thank you,
Technofunda24
#WatchOutFor#TechnicalViews
174 likes·85 comments