



Havells India - Technical view
HAVELLS
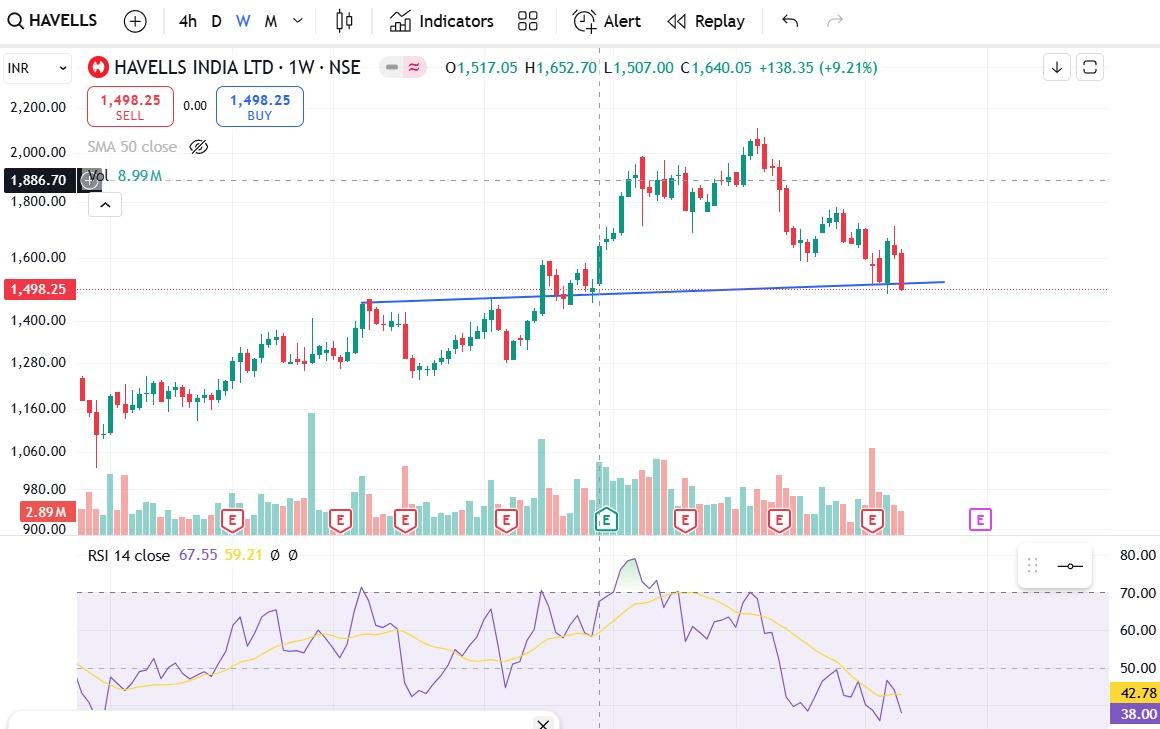
1) Chart attached in media
2) This is weekly chart
3) RSI below 40
4) Trendline drawn on chart
5) Price closing below the trendline
6) Technical bias is bearish now
7) New support for the stock at 1400-1420
8) On the upside resistance at 1560-1580
9) This is only for information and learning.
10) This is not a buy/sell call
Thank you,
Technofunda24
#StockInNews#TechnicalViews
181 likes·48 comments