



HDFC Bank - Technical Learning
HDFC Bank - Technical Learning - HDFCBANK
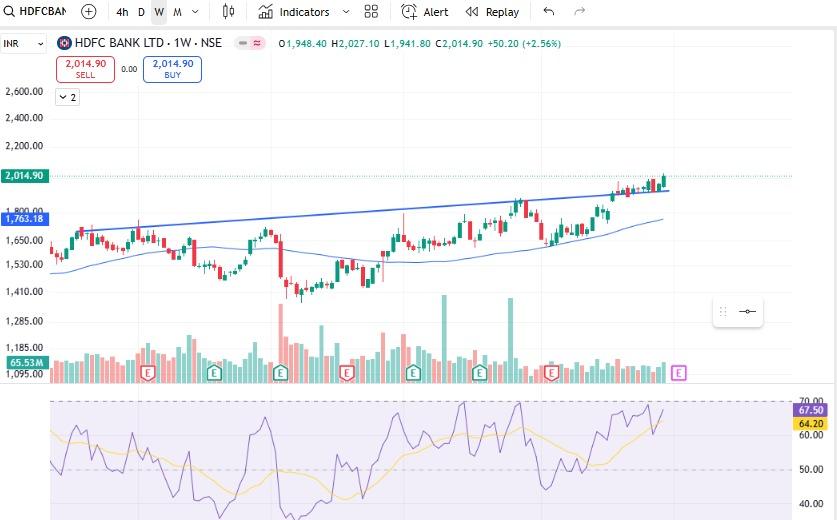
1) Chart attached in media
2) This is weekly chart
3) Trendline drawn on long term chart
4) We see that the trendline earlier was working as resistance now working as support
5) This is working as support since long on charts
6) 1930-1975 is the strong demand zone for the stock
7) Daily, weekly and monthly all RSI above 60
8) Bullish technical
9) Sentiment of banking sector is bullish as well.
10) Nifty/market bias is very bullish now
11) All this is for information only. This is not a buy/sell call
Thank you,
Technofunda24
#WatchOutFor#TechnicalViews
604 likes·78 comments